Customer Retention Strategies With Examples
Retention is a system, not a discount. Read four strategies with worked examples, and the measurement that tells you which one worked.
Retention programmes often begin with a coupon. A customer who was going to leave gets a discount, stays for a month, and leaves later with a lower perceived value of the product. The better question is why the customer was leaving — and whether the business can change that cause.
Direct answer: Retention improves when onboarding, product value, support, and win-back are designed as a system with a measured baseline. AAPOR's standards are a useful reminder to define the population and wording when measuring attitudes, and demand-generation material distinguishes the work of building preference from the mechanics of capture. The boundary: a retention tactic that raises a score without changing behaviour is not retention — it is measurement drift.
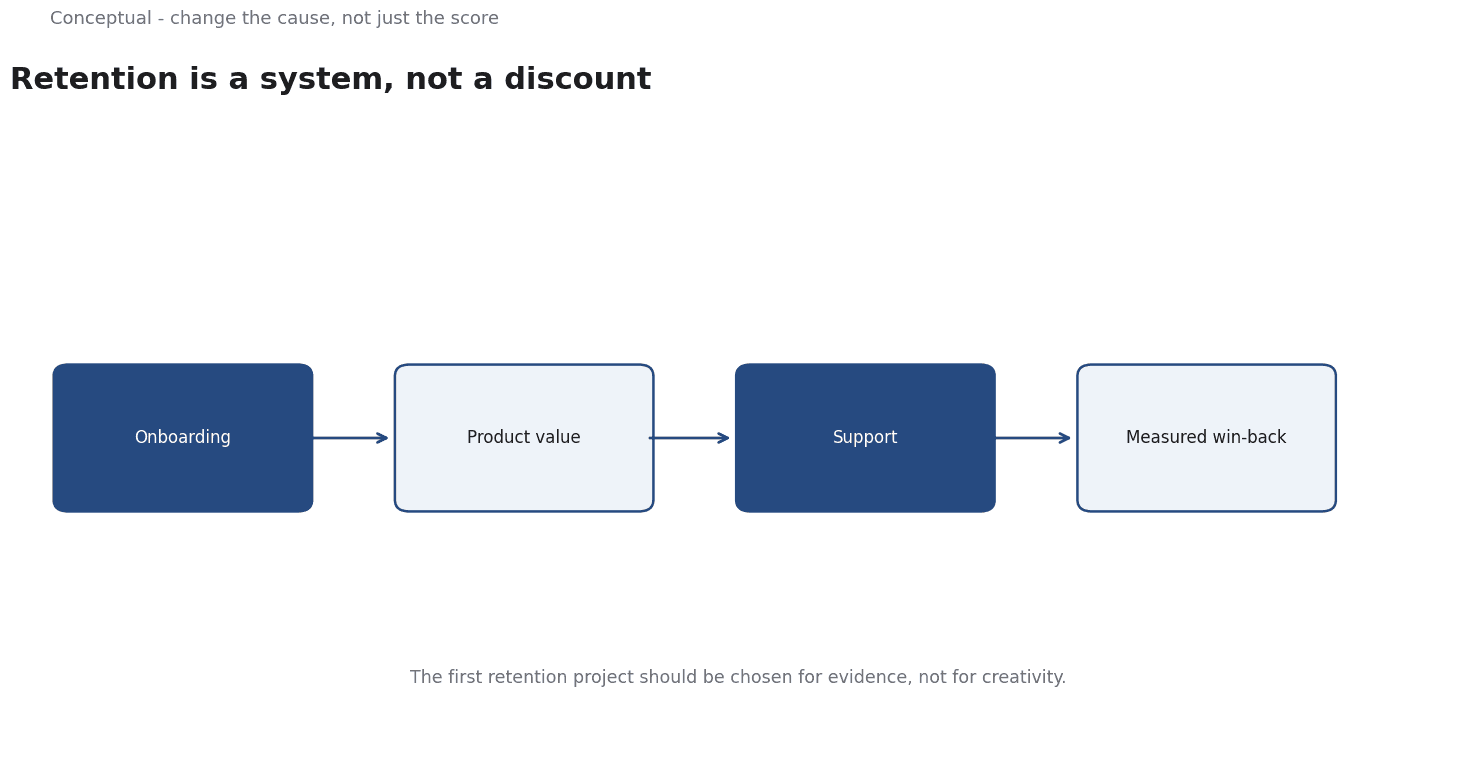
Four strategies
1. Onboarding that reaches value quickly. The first session determines whether a customer understands the product. Measure time to first meaningful action, not feature clicks. The customer-success article covers the health-score side.
2. Habit formation around the core use. A product used weekly becomes part of a routine; one used at renewal time does not. Identify the action that predicts retention and design reminders around it — carefully, because notification fatigue is real.
3. Support that resolves the cause. A support interaction that fixes the immediate issue but leaves the underlying frustration is a churn risk. Track repeat contacts on the same topic.
4. Win-back with a reason to return. A "we miss you" discount is weaker than a specific improvement: the feature the customer asked for now exists, the issue that frustrated them is fixed. Reaching out with that evidence is more credible.
A worked example of a retention decision
The following is hypothetical and illustrative.
A subscription product has 10,000 customers and a monthly churn rate of 4%. Four interventions are proposed:
- Better onboarding emails, costing 10,000 once.
- A usage reminder, costing 2,000.
- A support follow-up on resolved tickets, costing 8,000 a year.
- A 20% win-back discount, costing 40 a customer redeemed.
Three checks decide the order:
- Where does churn happen? If 60% of churn occurs in the first 30 days, onboarding is the first lever. If it happens after a support ticket, the support follow-up is the lever. The data decides.
- What is the baseline? Measure the current first-month churn and repeat-contact rate. Without a baseline, a change in the metric cannot be attributed to the intervention.
- What is the counterfactual? A win-back discount credits itself with every redeemer, including those who would have returned anyway. A holdout group is needed to estimate the effect, as Marketing Attribution: Multi-Touch Models, Incrementality, and Budget Allocation explains.
Three conclusions follow:
- Sequence by the churn stage, not by which tactic sounds cheapest.
- A discount is the last lever, because it trains customers to wait for one and compresses margin.
- Measurement is part of the programme. Each intervention needs a cohort and a comparison, or the team cannot learn which one worked.
Choosing the first intervention
The first retention project should be chosen for evidence, not for creativity.
Three properties make a good candidate:
A measurable cause. If churn clusters in the first month or after a specific support interaction, the cause is narrow enough to test. If customers leave for a dozen unrelated reasons, the first project is diagnosis, not intervention.
A reversible change. Onboarding emails and support follow-ups can be changed back. A price change or a product removal cannot be reversed cheaply, so it belongs later in the programme once the evidence is stronger.
A short feedback loop. A tactic whose effect appears in a week can be learned from quickly. One whose effect appears after an annual renewal consumes a year of runway to test. Short cycles let a team run three tests in the time one long test would take.
These criteria explain why onboarding is usually a better first project than a loyalty scheme. It is measurable, reversible, and fast — and it addresses the stage where the most customers are lost in many subscription businesses.
What retention metrics hide
Averages conceal cohorts. A 4% monthly churn rate may be 1% for long-term customers and 15% for new ones. Aggregate retention will not show where the problem is.
Satisfaction scores can drift. If a survey is sent only to engaged customers, the score will flatter the product. Define the population and wording, as AAPOR's standards require.
Discounts can look like retention. A redeemed coupon keeps a customer active for a billing cycle. Whether it changed the underlying behaviour is a different question, answered by a holdout.
The counterargument — that retention is simply good customer service — is true at the level of principle and unhelpful at the level of investment.
A team still has to decide which of several plausible causes is producing the churn, which requires data.
A decision test
- Measure churn by cohort and stage, not as one aggregate.
- Identify the action that predicts retention in your product.
- Fix onboarding first if early churn dominates.
- Track repeat contacts on the same issue as a support signal.
- Use win-back with specific evidence of improvement, not a generic discount.
- Run a holdout for any incentive with a material cost.
- Review by cohort after each intervention.
For the metric context, see Customer Lifetime Value; for the measurement method, see Marketing Attribution.
References & Further Reading
- American Association for Public Opinion Research, 2026. AAPOR — The professional association for public opinion and survey research; its standards and resources underpin the survey-design discussion.
- Wikipedia contributors, 2026. Demand generation - Wikipedia — An overview of demand generation as a marketing discipline distinct from lead generation; secondary reference used with the lead-generation entry.