Customer Lifetime Value Best Practices
Customer lifetime value is an estimate, not a constant. Read how retention, margin, and discount rate interact, with a worked example and an acquisition decision test.
Customer lifetime value is frequently reported as a precise number that guides acquisition spend, while the inputs behind it are estimates of future behavior. The customer lifetime value entry frames the metric as the total worth of a customer relationship; the customer retention entry describes the behaviors that keep a customer engaged. The problem is that a single figure hides more than it reveals about how that value is built.
Direct answer: Treat customer lifetime value as a scenario output rather than a constant: vary retention, margin, and discount rate, then make acquisition decisions against the resulting range. Retention is the lever with the largest effect because small changes in churn compound over the length of the relationship. The boundary is that this is an estimate of future behavior, not a measurement of any individual customer.
Delta: This article adds a claim-status table and a decision test beyond the sources: it maps each lifetime-value input to the acquisition or retention decision it supports, with claim status explicit.
The mechanism
Customer lifetime value estimates the present value of the future cash flows attributed to a customer relationship. The important concept is that it combines retention, margin, and the time value of money into one figure. The practical consequence is that every input is an assumption about future behavior, so the output inherits the uncertainty of all three at once.
Reporting a single figure implies a precision the inputs do not possess, and the more distant the cash flows, the more the discount rate shapes the answer.
A useful report shows the inputs beside the output.
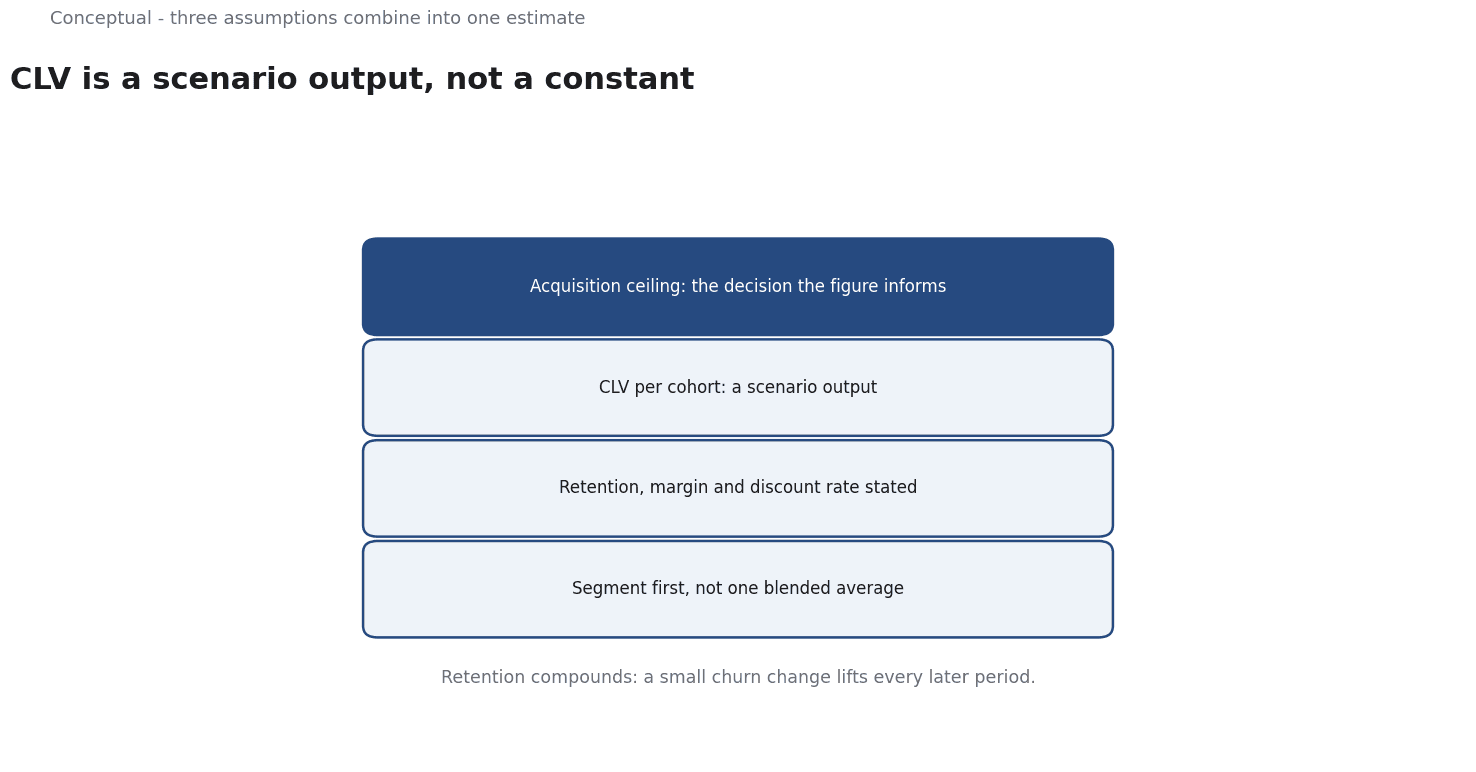
Retention describes the tendency of customers to continue the relationship, and churn is its complement. The mechanism matters because churn compounds: each period's surviving customers form the base for the next period. A small improvement in retention therefore raises lifetime value disproportionately when the expected relationship is long, since it keeps more customers in every later period. The practical consequence is that retention deserves as much analytical attention as acquisition volume when lifetime value is the target, even though acquisition is usually the more visible budget line.
The design choice that follows is to segment before computing. A single value averaged across all customers merges groups with different retention and different margin, and the average is a poor basis for a decision about either group. The practical discipline is to compute value by cohort or segment, keep the input assumptions visible, and state which decision the number is meant to inform, whether an acquisition ceiling or a retention investment. A figure produced without a named decision tends to become a decorative metric rather than an input to a choice.
The last step is to make claim status explicit. The descriptions of customer lifetime value and of retention are source-reported. The statement that retention is the dominant lever is inferred from how the inputs compound over time. Keeping that distinction visible prevents a sensitivity that this analysis derived from being read as a fact the sources asserted.
A worked example
The following is hypothetical and illustrative. A subscription business has two cohorts with different churn rates and wants to set an acquisition ceiling. Three checks decide. First, is margin measured per segment rather than blended across products with different cost structures? Second, is retention expressed as a rate applied to a defined cohort over a defined period, rather than as a general impression of loyalty? Third, does the acquisition ceiling change when retention improves by a modest amount, holding margin and discount rate fixed? The outcome is a short record showing the value for each cohort, the input that drove the difference, and the ceiling each cohort supports. If a modest retention improvement raises the value enough to justify a higher ceiling, the team should fund retention work before increasing acquisition budget.
Evidence status
| Claim | Status | Source | Verified | Recheck when |
|---|---|---|---|---|
| CLV estimates the total worth of a customer relationship | source-reported | Wikipedia CLV | 2026-11-18 | Definition revised |
| Retention describes continued customer engagement | source-reported | Wikipedia Retention | 2026-11-18 | Definition revised |
| Retention is the dominant CLV lever is inferred | inferred | Derived from the sources | 2026-11-18 | Cohort data changes |
Two rows restate documented descriptions of the metric and of retention behavior. The third row is a sensitivity derived from how the inputs combine, not a claim made by the sources. Recheck the documented rows when the reference definitions change and the inferred row when cohort behavior or margin structure changes.
What it cannot do
Customer lifetime value cannot measure an individual customer's future. It is a cohort estimate built from average behavior, and the outcomes of individual customers vary widely around that average. Using it to decide how much to spend on one named prospect mistakes a statistical tendency for a prediction about a person. The estimate is useful for setting a policy across many customers, because averages stabilize over a large enough group; it is not useful as a verdict on a single account.
The hidden cost is data maintenance. Computing a defensible value requires linking acquisition source to realized margin and to retention over time. That linkage is often incomplete: channel labels change, discounts are applied in systems that do not feed the model, and service costs are recorded separately from revenue. Building the linkage is slower than computing the formula, and the formula is the part that attracts attention. A team that reports lifetime value without maintaining the underlying linkage is reporting an assumption in the language of a measurement.
A high lifetime value may reflect customers who would have arrived without the campaign, in which case spending up to that value destroys margin. The average across segments creates a second failure: a valuable segment and a marginal one can average into a figure that makes both decisions look reasonable while neither is right. The defense is to compute by cohort, keep the inputs visible, and test whether the spending actually changes customer behavior before raising the ceiling.
There is also a boundary in what the sources provide. They define the metric and describe retention; they do not set an accounting policy for margin, choose a discount rate, or decide which costs belong in the calculation. Those are local choices with material effects on the result, and they should be recorded with the number. Treating the metric definition as if it settled these choices is a category error, since two teams can compute different but equally defensible values from the same customer data.
Finally, the inputs need scheduled review. Churn shifts with product changes and competitive pressure, margin moves with cost structure, and the appropriate discount rate changes with the cost of capital. A value computed once and reused for several planning cycles will drift away from the behavior it was meant to summarize. The review should check the inputs rather than the output, because a stable output can hide offsetting changes in retention and margin that matter for the decision.
Counterargument: "The counterargument that a simple average is good enough is fair for a stable single-product business, and incomplete when retention or margin differs materially across cohorts."
A decision test
- Name the decision the value is meant to inform, such as an acquisition ceiling.
- Define the customer cohort and the period over which value is measured.
- State the margin, retention, and discount-rate inputs explicitly.
- Compute the value by segment rather than as one blended average.
- Re-run the calculation with one input changed at a time to see which dominates.
- Test whether extra acquisition spending actually changes customer behavior.
- Set a review date for the inputs and record who owns each one.
The test is meant to convert an estimate into a decision input. If a team cannot say which input drives the number or which choice it informs, the metric is decorative. Recording the inputs beside the output makes the calculation auditable and keeps a later reader from treating an assumption as a measurement. For further reading, see Voice of customer: turning feedback into decisions.
References & Further Reading
- Wikipedia contributors, 2026. Customer lifetime value - Wikipedia — Predicted net value of a customer relationship.
- Wikipedia contributors, 2026. Customer retention - Wikipedia — Efforts to keep existing customers.