Customer Segmentation: Common Questions
Common questions about customer segmentation answered through a data-modeling and conjoint-analysis lens, with claim status and decision boundaries made explicit.
Customer segmentation is often presented as a fixed set of buckets, but the real difficulty is deciding which customer attributes can support a decision. Teams confuse demographic labels with needs, and they rarely test whether a segment is stable. This article treats segmentation as a data and measurement problem grounded in the supplied sources.
Direct answer: A useful segment rests on a data model that defines which entities and attributes are comparable, and on preference evidence that shows customers actually differ in what they value. The sources describe data modeling and conjoint analysis as separate disciplines; neither alone yields a validated segment. The bounded answer is to build the model first, measure trade-offs second, and label which part of the claim is observed versus inferred.
Delta: This article adds a decision mapping beyond the sources: it maps a customer data model and conjoint utilities to actionable segmentation choices, with claim status explicit.
The mechanism
Data modeling introduces conceptual, logical, and physical layers that specify entities, attributes, and relationships. Applied to customers, this forces clarity about what a customer record contains and how it links to transactions and behaviors. The practical consequence is that a segment is only as reproducible as the model behind it; if attributes are undefined, two analysts will build different segments from the same population and neither will be able to explain why.
Conjoint analysis is a survey method that estimates how people value product or service attributes by asking them to choose among combinations. It produces part-worth utilities that separate the contribution of individual attributes. The practical consequence is that it reveals trade-offs that direct questions miss, so it can distinguish customers who claim to want the same feature but weight price very differently. Stated preference is not the same as revealed purchase, but it is a structured way to probe value.
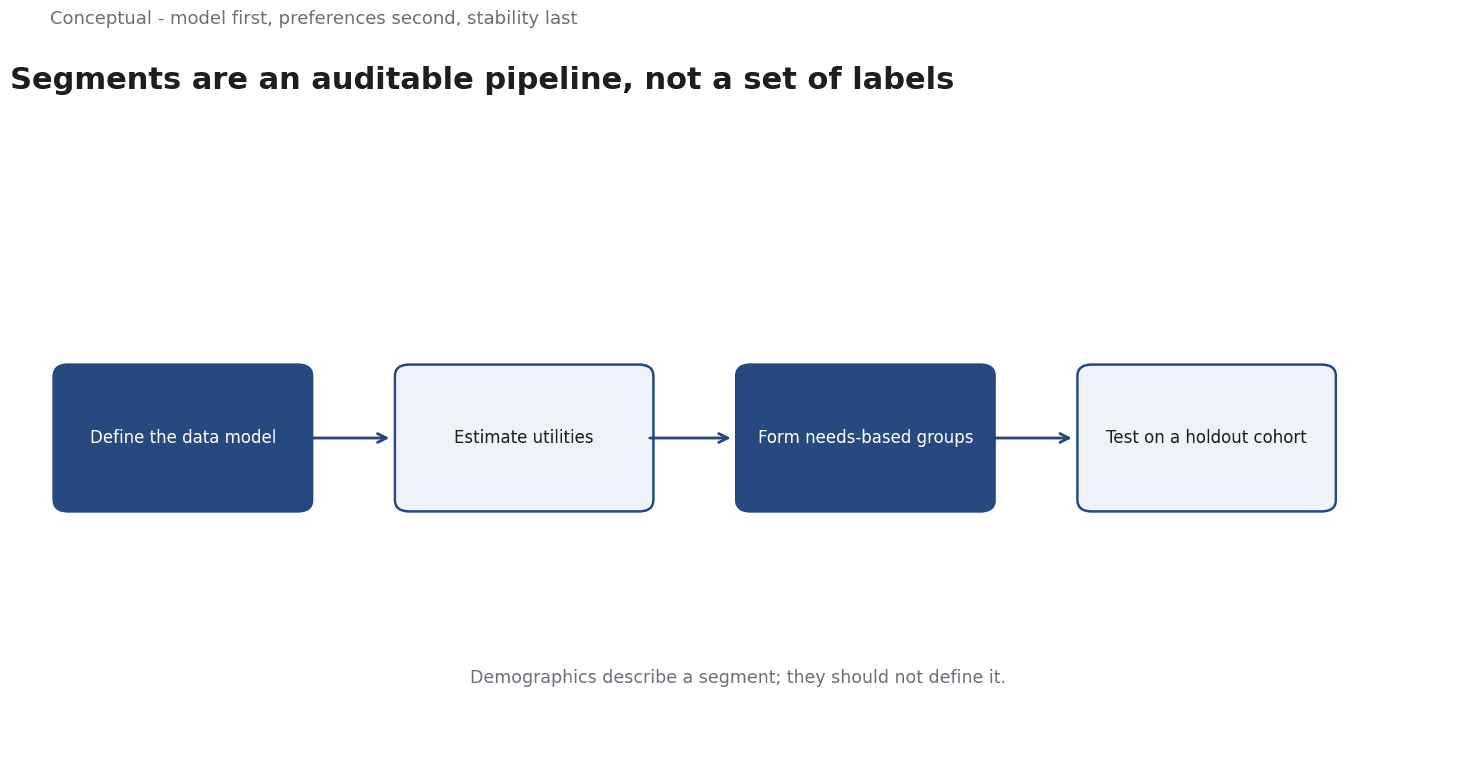
Combining the two gives a needs-based segmentation path. The data model defines the observable attributes and the unit of analysis; conjoint supplies the preference dimensions that indicate genuine differences in value. Demographic labels can then be used to describe segments rather than to define them, which reduces the risk of targeting a proxy for a preference that does not actually drive choice.
The decision consequence is that segmentation becomes an auditable pipeline: define entities, choose attributes, measure utilities, then test stability.
Each stage has a failure mode, and each can be reviewed independently. The sources justify the methods; the thresholds, validation rules, and retirement criteria come from the team that must act on the result.
A worked example
The following is hypothetical and illustrative. A subscription product wanted segments for pricing experiments. Three checks were run. First, the data model was inspected: plan, usage, and tenure were defined consistently, while industry was free text and unusable. Second, a conjoint design covered price, feature depth, and support level, and showed two clusters with different price sensitivity. Third, the clusters were re-estimated on a later cohort to test stability; one held and one dissolved. The outcome was to pursue the stable cluster and drop the other. This scenario is illustrative, not a measured case.
Evidence status
| Claim | Status | Source | Verified | Recheck when |
|---|---|---|---|---|
| Data modeling defines entities, attributes, and relationships that structure customer data | source-reported | Data modeling Wikipedia | 2026-11-18 | When data modeling conventions are revised |
| Conjoint analysis estimates part-worth utilities from choices among attribute combinations | source-reported | Conjoint analysis Wikipedia | 2026-11-18 | When stated-preference methods change |
| Needs-based segments are more actionable than demographic-only segments when built on a validated data model | inferred | Derived from the sources | 2026-11-18 | When behavioral validation data is available |
The source-reported rows restate concepts the references define directly. The inferred row captures the bridge from method to segmentation decision, and it is deliberately conditional on validation. Recheck conditions point to the specific events that would weaken each claim, so the claims can be revisited rather than treated as permanent.
What it cannot do
Data modeling is representational, not causal. A clean model makes segments consistent but does not prove that segment membership causes different behavior. Conjoint measures stated preferences in a hypothetical survey, so it can overstate demand that later appears in real purchasing. Neither method, on its own, establishes that acting on a segment will change an outcome, and that gap is where most segmentation projects fail.
There is a hidden cost to both. Conjoint studies require careful design and sufficient sample size; poorly chosen attributes produce utilities that look precise but mislead downstream decisions. Maintaining a customer data model is ongoing work, and attribute definitions drift as the product changes. A segment built on last year's taxonomy can be internally consistent and completely obsolete, which is a particularly hard failure to detect because the model itself shows no error.
The most common failure mode is overfitting. Enough attributes will always produce groups, and small groups can look distinct by chance.
Analysts are incentivized to find clean stories, so the default should be skepticism until a segment survives re-estimation on data it was not built from.
There is also a boundary on what the sources cover. They are generic and do not prescribe segment counts, sampling rules, or how to handle longitudinal drift. Different markets and cultures may weight attributes differently, so a segment validated in one context may not transfer to another. The sources provide method vocabulary, not a decision threshold, and any threshold a team chooses is its own responsibility.
Both the data model and the utility estimates age as pricing, product, and customer mix change. Segments need scheduled re-estimation and explicit retirement criteria, otherwise a once-useful partition quietly becomes a constraint on experiment design. Assign an owner to review the definitions and the evidence on a fixed cadence.
The counterargument that demographic segments are fair for quick descriptive reporting is reasonable, but incomplete for targeting: they describe who a customer is, not what the customer values or how the customer will respond.
A decision test
- Define the unit of analysis and the entities in the customer data model.
- Audit attribute definitions for consistency and completeness.
- Choose attributes that a decision can actually change.
- Design a conjoint study covering price and key product attributes.
- Estimate utilities and form candidate segments.
- Test segment stability on a holdout or later cohort.
- Label each segment claim as observed or inferred before targeting.
These steps make segmentation a repeatable procedure rather than a naming exercise. The aim is to expose which parts of a segment are measured and which are assumed, so targeting decisions carry explicit uncertainty. When stability fails, prefer description over action and rebuild the evidence. For further reading, see Voice of Customer: Turning Feedback into Decisions.
References & Further Reading
- Wikipedia contributors, 2026. Data modeling - Wikipedia — The structure and purpose of data models.
- Wikipedia contributors, 2026. Conjoint analysis - Wikipedia — Measuring preferences across product attributes.