Customer Lifetime Value: The Metric That Guides Acquisition
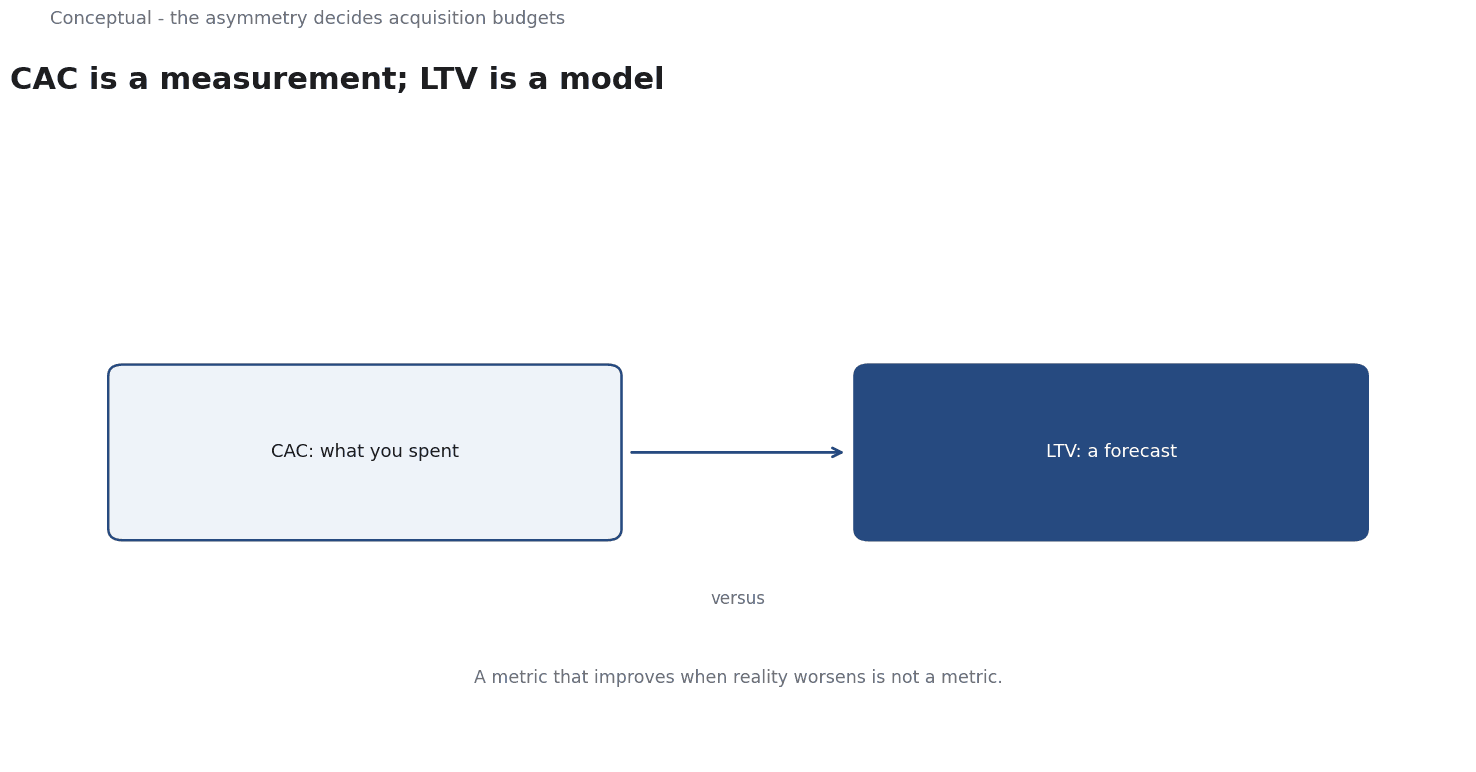
CAC is a measurement; LTV is a model. Read why that asymmetry decides acquisition budgets and how to build a number you can defend.
Customer lifetime value is the metric most acquisition decisions are supposed to be governed by, and it is routinely used in a way that cannot survive contact with an accountant. The problem is not that people calculate it. The problem is that they treat one half of the ratio as a fact and the other half as an estimate, and then act as if the estimate were the fact.
Direct answer: CAC is what you spent; LTV is a forecast built from assumptions about retention, margin, and discount rate. Treating a measurement and a model as equals is how companies end up buying customers at losses they cannot see. The defensible version of the metric is not the ratio but the pair: lifetime value, gross-margin-adjusted, against CAC, compared over a payback window that your cash position can actually tolerate.
The asymmetry that decides everything
CAC is knowable. You can read it off the spend and the new-customer count, reconcile it against the ledger, and the only judgement is the attribution window. LTV is not knowable. It requires three things you must forecast: how long the customer stays, what they buy while they are there, and what that revenue is worth in present money.
That asymmetry propagates through every decision built on the ratio. If a team can measure CAC precisely and LTV loosely, the natural drift is to defend the measurement and discount the model — which is exactly backwards, because the model is where the uncertainty that matters lives.
It also explains a common pattern: LTV improves in the model the moment growth gets hard. When CAC rises, teams refine the retention assumption, and the ratio appears to recover while the business is getting worse.
A metric that improves when reality worsens is not a metric.
What actually goes into the calculation
The components, and the failure mode of each:
Gross margin, not revenue. A customer who buys a low-margin product for three years is worth less than one who buys a high-margin product for a year. Using revenue overstates LTV by exactly the difference between your margin structure and 100%.
Retention measured as a rate, used as a curve. A monthly churn rate converts to an expected lifetime through a geometric relationship, which means small changes in churn produce large changes in the resulting LTV — and the relationship is highly sensitive to the curve's shape in the early months. Churn that is concentrated in month one is a different business from churn spread evenly.
Discounting. Money received in year three is worth less than money received today. If your discount rate is unstated, LTV is overstated by an amount that grows with the lifetime you assume.
And the acquisition cost needs the same treatment. CAC should include the cost of the opportunity, not just media spend, and if it does not, you have a ratio that flatters you by construction.
The metric that actually governs spend
Most acquisition decisions do not need a lifetime value. They need to know whether the payback period is acceptable given the company's cash, and whether the customers acquired at a given CAC have a positive expected margin over the horizon you are planning for.
This is a small change with large consequences. Payback period is measurable on a cohort basis within a defined window, and it is bounded by cash rather than by forecast. If the cohort acquired in March has not repaid its CAC by December, that is a fact, not a forecast.
The lifetime value number remains useful — but as the ceiling on what you could spend, computed from a cohort you have actually observed rather than from one you have modelled, and with the assumption stated next to it.
Getting the inputs right starts with events
Before any of this can be computed, the underlying behaviour has to be captured, and analytics systems make the event model explicit about what is possible.
Google Analytics describes it directly: "An event allows you to measure a specific interaction or occurrence on your website or app", with examples including when someone loads a page, clicks a link, completes a purchase, or when an app crashes or an impression is served. That definition carries a consequence that is easy to miss: what you can report is bounded by what you decided to record as an event.
A retention model computed from a funnel that tracks sign-ups but not the second session is not a weak model — it is measuring something else, and it will disagree with the finance team's version for reasons that have nothing to do with either team's competence. Before debating the LTV formula, check that the event definitions on both sides are the same events.
The same applies to product usage. Product-led growth teams organise around activation and engagement loops rather than around campaigns, and the loop is only visible if the events that constitute it are instrumented. If your activation event is "created a workspace" but the loop is "invited a colleague", the metric is a proxy for the loop rather than the loop, and it will drift as the product changes.
A checklist before the number goes in a deck
- Is it gross-margin-adjusted? If not, fix it before anything else.
- Which cohort is the retention curve from, and over what window? A curve from the most recent cohort is a forecast; one from a matured cohort is a measurement. Label which you have.
- Is CAC fully loaded — media, plus sales and marketing labour, plus the opportunity cost of the sales time?
- What is the payback period, and can the business fund that gap for the number of months it takes?
- What discount rate and what margin assumptions are inside the number, stated on the same slide?
- Would this number still support the decision if retention were one point worse? If not, the decision is riding on a fragile estimate and the experiment that reduces the uncertainty is worth more than the analysis.
- Do the event definitions match the ones the finance and product teams use? If not, reconcile before comparing.
For the definition-level primer on the four unit-economics metrics — CAC, LTV, churn and contribution margin — see Understanding Unit Economics; this article is the deeper treatment of LTV as an acquisition decision tool. For the retention mechanics behind these cohorts, see Customer Retention; for the acquisition side of the same ratio, see SEO vs Paid Advertising.
A worked example
The following is hypothetical and illustrative. Suppose a subscription firm considers doubling spend on one paid channel, justifying it with an LTV-to-CAC ratio of 3. Check 1: inputs. The LTV is rebuilt on gross margin rather than revenue, and the retention curve is taken from a matured cohort, not the newest one; the analytics events behind it are reconciled with finance, because a funnel that logs sign-ups but not the second session measures a proxy, per the cited event definition. Check 2: cash. Payback is computed on the March cohort and, under fully loaded CAC including sales time, that cohort has repaid its cost by December - a fact, not a forecast - and the stated cash position can fund that gap. Check 3: fragility. With the discount rate stated on the same slide, the ratio is tested against retention one point worse; if it still clears the payback threshold, the decision survives. The outcome is bounded: spend is capped at the payback ceiling from the observed cohort, while the lifetime figure is kept only as an upper bound, not as the basis for the budget.
A counterargument
A reasonable critic would push back that the payback window relocates the problem rather than solving it. Google Analytics' event definition makes the point: what can be reported is bounded by what was recorded, so a payback cohort built from sign-ups but not the second session is as much a proxy as the LTV it replaces. Wes Bush's activation framing sharpens it - if the event is 'created a workspace' while the loop is 'invited a colleague', both metrics drift as the product changes. NRF's sell-in versus sell-out distinction is a reminder that even revenue depends on which event is counted.
The warning against false precision is sound; the claim that a different metric escapes modelling is not.
References & Further Reading
- Google Analytics Help, 2026. About events (Google Analytics 4) — How an event is defined as a measurable interaction or occurrence, and why the event model determines what can be reported at all.
- Wes Bush, 2026. Product-Led Growth — The activation and engagement loop definition that PLG teams actually use.
- National Retail Federation, 2026. NRF Press Releases | Latest Statements & Announcements | NRF — Primary retail-sales and channel data for sell-in versus sell-out definitions.