Data Analytics vs Data Science: Differences, Workflows, and When to Use Each
The two disciplines ask different questions. Read how their workflows differ and how to staff the work without creating a bottleneck.
The distinction between data analytics and data science is usually drawn with examples of tools — SQL and dashboards versus Python and models — and the examples obscure the thing that matters. Both use code; both use statistics; the difference is the question they are built to answer and the standard of evidence that answers requires.
Direct answer: Data analytics explains what happened and why, using descriptive and diagnostic methods on existing data. Data science builds models that predict or decide, and its answers are evaluated against held-out data rather than against a narrative. The workflows differ in their validation step: an analytics project is checked for correctness and clarity; a data science project is checked for generalisation. Choosing the wrong one for a question produces either an expensive model where a query would have done, or a dashboard that cannot answer a predictive question.
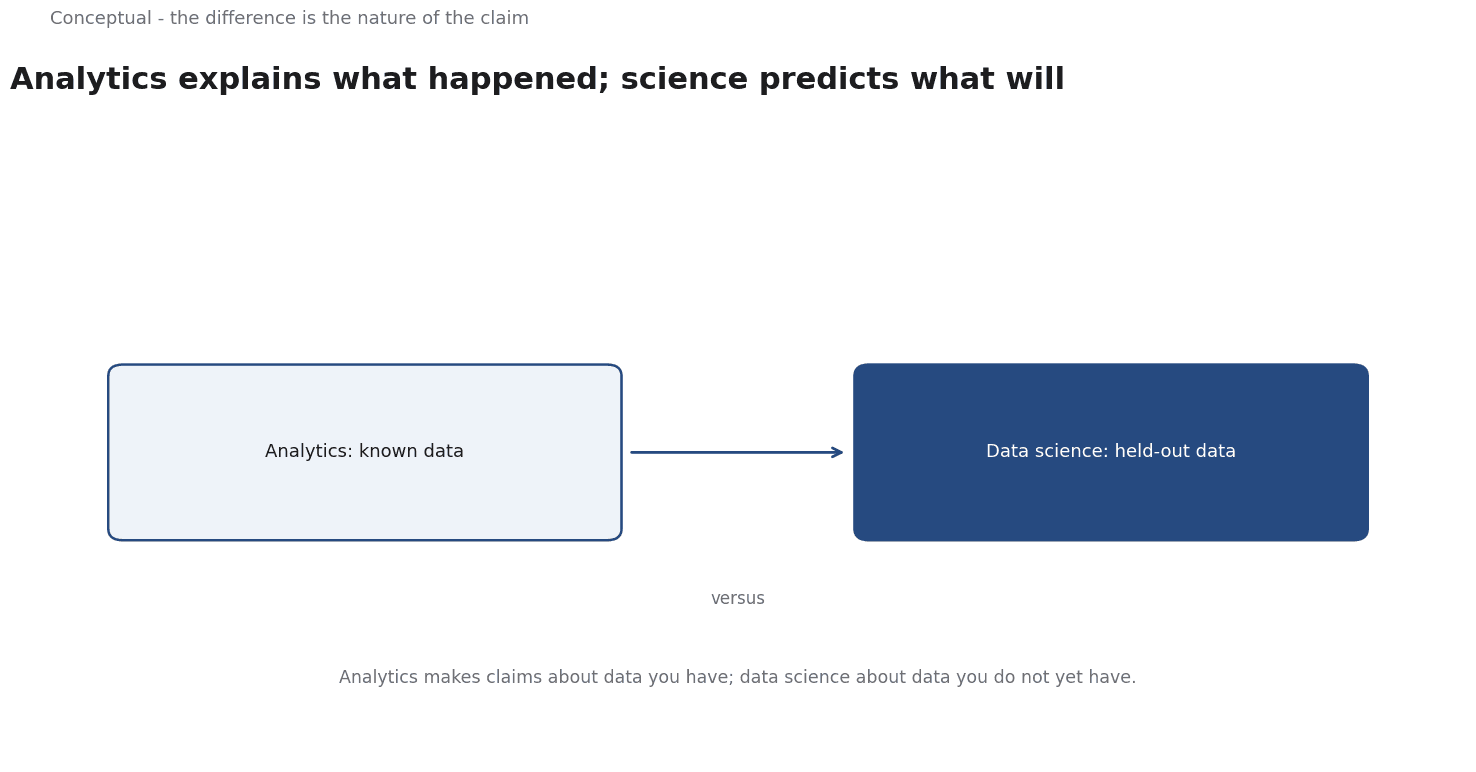
Two different questions
An analytics question sounds like: what was our retention by cohort last quarter, and which segment drove the change? The answer is a measurement with a clear definition and a transparent derivation. It is checked by reconciling against the source and by whether a reader can follow the logic.
A data science question sounds like: given a customer's behaviour so far, what is the probability they will churn next month? The answer is a model, and it is evaluated on customers it has never seen. It is checked by held-out performance, calibration, and robustness — not by whether the explanation feels persuasive.
The distinction is not about difficulty. A well-executed analysis can be harder than a straightforward model.
It is about the nature of the claim: analytics makes claims about data you have; data science makes claims about data you do not yet have.
Where the workflows diverge
Both start with a question and data preparation, and they diverge at validation.
Analytics workflow: define the metric, verify the source, compute, visualise, interpret, communicate. The critical failure mode is a definitional one — two people computing "active customer" differently — and the critical quality control is reproducibility: can someone else rerun the query and get the same number?
Data science workflow: define the target, build features, choose a model, validate on held-out data, tune, evaluate, deploy and monitor. The critical failure mode is leakage — using information that will not be available at prediction time — and the critical quality control is a split that matches deployment.
scikit-learn's guidance states the rule for the data science side: it is "common practice when performing a (supervised) machine learning experiment to hold out part of the available data as a test set", because otherwise the model overfits. Kuhn and Johnson make the complementary point that good modelling requires "other good practices" around representation and validation, not just an algorithm.
An analytics team that adopts a model without a held-out evaluation has made a category error; a data science team that produces a dashboard without a clear metric definition has made the opposite one.
When to use which
Use analytics when the question is about the past, the answer needs to be auditable by many people, and the decision does not require a per-case prediction. Reporting, funnel analysis, cohort analysis, A/B test readout, and operational dashboards are analytics work.
Use data science when the decision applies to individual cases at scale, the future outcome matters, and you can measure accuracy on held-out examples. Churn scoring, demand forecasting, ranking, fraud detection, and personalisation are data science work.
There is a wide middle ground, and it is where many teams get stuck. A model that produces a single forecast for a planning meeting is often analytics with extra steps — the value is in the explanation and the scenario, not in generalisation. A rule-based scoring system that has to work on millions of cases is data science even if the "model" is a simple logistic regression.
Staffing the two without a bottleneck
The analytics work always wins because it has a deadline and a named requester.
Three structures work better:
- Separate the on-call analytical work from the project work. Rotating a data scientist through dashboard requests destroys the continuity a modelling project needs.
- Make analytics self-serve where the definitions are stable. A well-modelled semantic layer lets business users answer their own descriptive questions, which is the premise of tools like Power BI and the reason the model matters more than the chart.
- Give data science a roadmap with fewer, longer items. A model that has to be validated, deployed, and monitored cannot be delivered in the same cadence as a weekly report.
The CUPED result — a reported variance reduction of about 50% using pre-experiment data — is a useful reminder that analytics infrastructure is also an enabler of science: without the pre-period data logged, the variance-reduction method is unavailable.
A decision checklist
- Is the question about what happened or about what will happen to a specific case? That decides the discipline.
- What standard of proof applies? Reconciliation and clarity, or held-out performance?
- Can you measure the answer's accuracy? If not, you are doing analytics even if you used a model.
- Does the decision repeat at scale? If yes, the investment in validation and monitoring pays off.
- Who consumes the output? A broad audience needs a transparent derivation; an automated system needs a reliable interface and a monitoring signal.
- Are the two workflows competing for the same people? If so, separate them before the modelling work disappears.
For the modelling end of the distinction, see Feature Engineering; for the reporting end, see Power BI for Business Analytics.
A counterargument
A reasonable critic would push back that the divide between claims about data you have and claims about data you do not yet have fails the article's own middle-ground test. A single forecast for a planning meeting is called analytics with extra steps, yet it concerns the future and needs held-out evaluation, which is the data-science standard by the article's definition. Kuhn and Johnson argue that good modelling requires practices around representation and validation; those apply to a dashboard metric too, since a reproducible query can mislead when the process behind it changes. scikit-learn's cross-validation guidance is about generalisation, and so is any claim to survive the next quarter. The Stack Overflow survey's tooling categories reinforce a divide that is partly about org charts.
The staffing advice is useful; the epistemological claim is overstated.
References & Further Reading
- Max Kuhn and Kjell Johnson, 2019. Feature Engineering and Selection: A Practical Approach for Predictive Models — The closest thing to a reference text on feature construction, resampling, and selection.
- scikit-learn developers, 2026. Cross-validation: evaluating estimator performance (scikit-learn) — Time-series splits and the validation design that keeps a backtest honest.
- Stack Overflow, 2026. Developer Survey — The recurring cross-stack developer survey used for adoption and tooling claims.