Power BI for Business Analytics: Data Modeling, DAX, and Dashboard Best Practices
Power BI is a modelling tool with a chart layer on top. Read why the semantic model decides everything and how DAX actually fits.
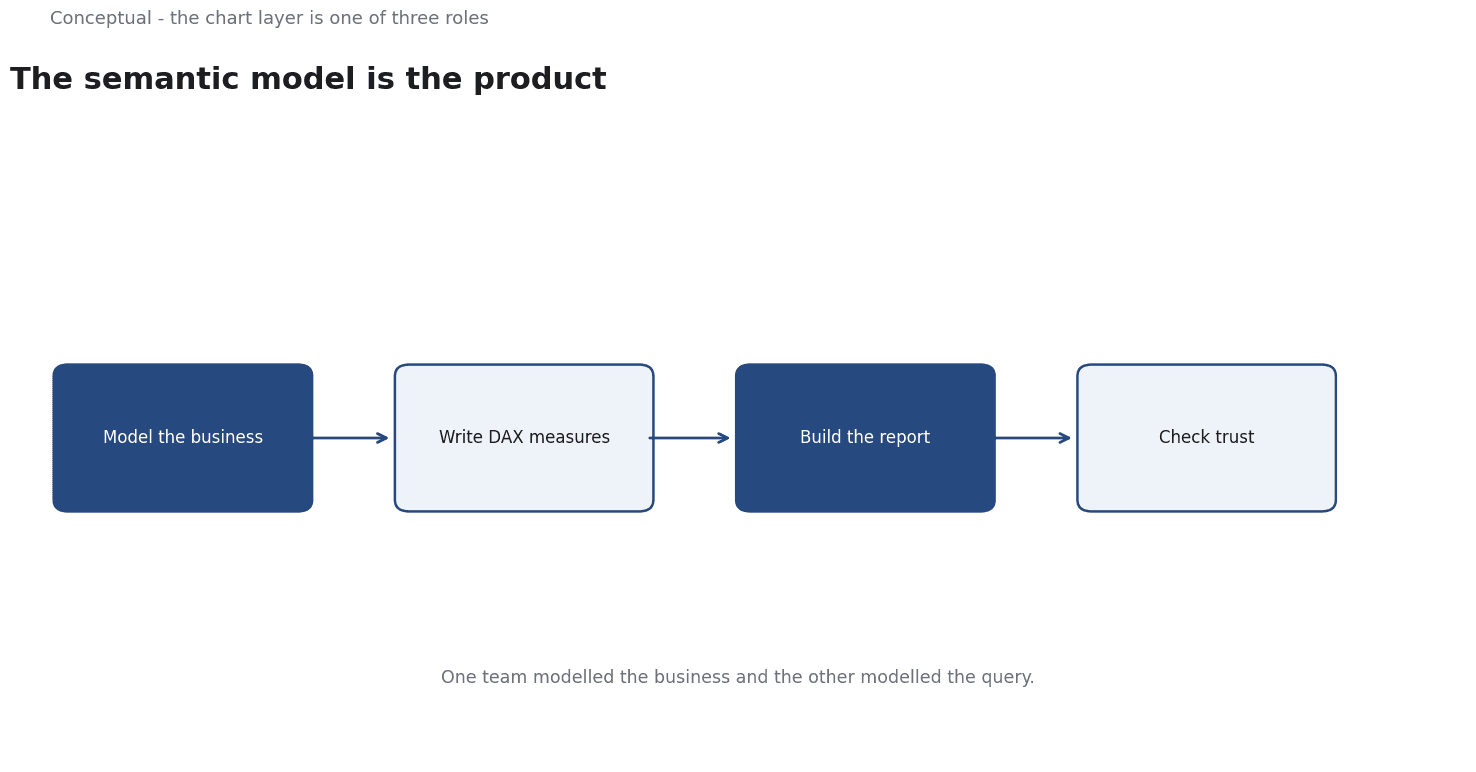
Most Power BI tutorials teach the interface, and the interface is the least consequential part of the tool. Two teams can build visually identical dashboards from the same data, and one of them will be trusted by finance and the other will not, because one of them modelled the business and the other modelled the query.
Direct answer: Power BI's own documentation describes the product as covering "cloud capabilities in Microsoft Fabric, standalone desktop and on-premises applications, and guidance tailored to your role—whether you create reports, model data, or consume insights".
That last clause is the design brief: the reporting layer is one of three roles, and the modelling layer is where the value is decided.
The order that works is model first, measure second, visualise third — and the reason is that a measure computed correctly once can be reused everywhere, while a number typed into a visual has to be re-derived and re-checked every time someone adds a page.
Why the semantic model is the product
A semantic model is a description of your business expressed as entities, relationships, and measures. It is not a query result and it is not a table; it is a layer between the source data and every question anyone will ask.
The benefit is that it makes disagreement about definitions impossible to hide. If "active customer" appears in three dashboards with three definitions, the problem is not the dashboards — it is that the definition lives in each dashboard instead of in the model. Putting it in the model means it exists once, and every report inherits it.
This also changes what a new report costs. With a modelled source, adding a metric is a measure and a visual. Without one, it is a new query, a new column, and a fresh round of validation — and it is the second path that usually gets taken, because the first path requires someone to understand the model.
DAX is a measure language, and the distinction matters
Microsoft's DAX reference describes "the over 250 functions used in Data Analysis Expressions", each documented with syntax, parameters, return values, and examples. Two hundred and fifty functions is a lot, and it is worth being clear about what most of them are for.
DAX comes in two families, and mixing them up is the most common source of confusion:
Measures are calculated at query time in the context of the report's current filters and groupings. A measure is a question. It is evaluated against whatever slice of the data the user is looking at, which is why a single measure can serve a total row, a month, a category, and a filtered view correctly without being rewritten.
Calculated columns are computed at refresh time, row by row, and then stored. They are a transformation, not a question. They are also expensive: a calculated column over a large fact table is processed on every refresh, it is materialised into the model, and it cannot respond to slicers the way a measure can.
The practical rule that follows is simple and worth internalising: if the value depends on the context the user is currently viewing, it is a measure. If it depends only on the row, it is a calculated column.
The modelling choices that decide everything
Three decisions account for most of the difference between a model that performs and one that does not.
The grain of the fact table. A fact table has one row per event at a stated grain. Most bad models contain a fact table at two grains, which forces the tool to invent a relationship that is not true and produces numbers that are subtly wrong in ways that are hard to spot.
The direction of the relationships and the cardinality. Dimensions filter facts; facts do not filter dimensions in a well-formed model. When you find yourself writing a measure that has to "unpivot" something, the model is fighting you, and the fix is in the model rather than in the measure.
Star schema over snowflake. A flat dimension set around a fact table is simple to reason about and fast to query. A fully normalised dimension hierarchy is elegant on paper and expensive in practice, and the denormalisation cost is usually less than the modelling and query cost of the alternative.
Performance is usually a modelling symptom
When a report is slow, the instinct is to look for a setting to change. Usually the cause is structural: a calculated column on a wide fact table, a relationship that prevents filter propagation, a measure that iterates rows rather than sets, or a source that has not been pushed into the right form before it enters the model.
Each of those is fixable in the model, and fixing it there fixes every report built on top.
Tuning the query engine is treating the symptom.
There is one external factor that is genuinely worth checking before blaming the model: the source. A dashboard reading a live transactional table will be slow regardless of how well it is modelled, because the problem is the access pattern, not the expression engine.
A build order that avoids rework
- Write the grain of every table before loading anything. If you cannot state it in one sentence, the table is not ready.
- Build the dimensional model and the relationships. Validate that each fact connects to its dimensions in one hop where possible.
- Create the measures library, and only then build a report. A shared measure library is the thing that makes the second report cheap.
- Check that each measure has one definition and one name. Two measures for the same number is the beginning of an argument.
- Only then visualise. The visual is the last step because it is the only one that is cheap to change.
- Validate the totals against the source system for the three numbers finance will check, and keep the reconciliation visible to reviewers.
For the organisational question of where analytics capability sits and how it competes for attention, see Data Strategy; for how to present the output so it drives decisions, see Data Visualization.
A worked example
The following is hypothetical and illustrative. A finance team is building a sales dashboard and two analysts produce different revenue totals. Instead of tuning the visual, the team audits the model with three checks from the build order. First, it states the grain of the sales fact table in one sentence and discovers one table holds both order-level and daily-summary rows, the mixed-grain fault that forces a false relationship and wrong numbers. Second, it separates measures from calculated columns: a value that depended on the report's date slicer had been stored as a calculated column, so it could not respond to filters; the team rewrites it as a measure, the distinction the DAX reference's function families imply. Third, it checks that the fact table connects to its dimensions in one hop around a star schema and that each number has a single definition and name. The bounded outcome is one shared measure library feeding both dashboards, with totals reconciled to the source system for the three figures finance checks. The second report becomes a measure and a visual rather than a fresh query and a fresh argument.
For an applied console built on a star-schema cube with cross-filtering, URL state, and a stale-data badge, see the BTC Monthly ML case study.
A counterargument
The ordered build sequence is presented as a law, and the sources describe capabilities rather than prescribe it. Microsoft's documentation says the platform spans cloud, desktop, and on-premises use with role-based guidance for creating reports, modelling data, and consuming insights - it does not rank those roles or claim the model is where value is decided. A critic could ask at what scale a semantic model repays its cost: for a one-off, single-report analysis, the 'measure once, reuse everywhere' benefit never materialises, yet no threshold is offered. The DAX reference documents over 250 functions but does not establish that the measure-versus-calculated-column distinction is the central one; that rule, like 'model before visualise', is a local judgement. Useful framing, but the sources do not license a universal order.
References & Further Reading
- Microsoft Learn, 2026. Power BI documentation — How the platform divides between cloud capabilities in Microsoft Fabric, standalone desktop, and on-premises, and the role-based guidance for building reports, modelling data, or consuming insights.
- Microsoft Learn, 2026. DAX function reference — The reference for the over 250 functions used in Data Analysis Expressions, with syntax, parameters, return values, and examples.
- U.S. Census Bureau, 2026. Business Trends and Outlook Survey — Official small-business AI adoption measurement.