Data Strategy: How Organizations Use Data to Compete
A data strategy is a list of decisions, not a list of dashboards. Read how to connect the data you collect to the decisions you actually make.
Data strategy has an image problem. It is usually presented as a stack diagram — sources, warehouse, lakehouse, dashboards, machine learning — and the implication is that assembling the stack produces the strategy. It does. The stack is the cost; the strategy is deciding which decisions the data changes.
Direct answer: A data strategy answers three questions: which decisions need to change based on new information, what data and instrumentation those decisions require, and what cadence they are made at. Everything else — platforms, models, dashboards — is an enabler chosen to serve those answers.
The measurable test of a data strategy is not the volume of data collected but the number of decisions whose outcomes have improved because the data arrived in time to act on them.
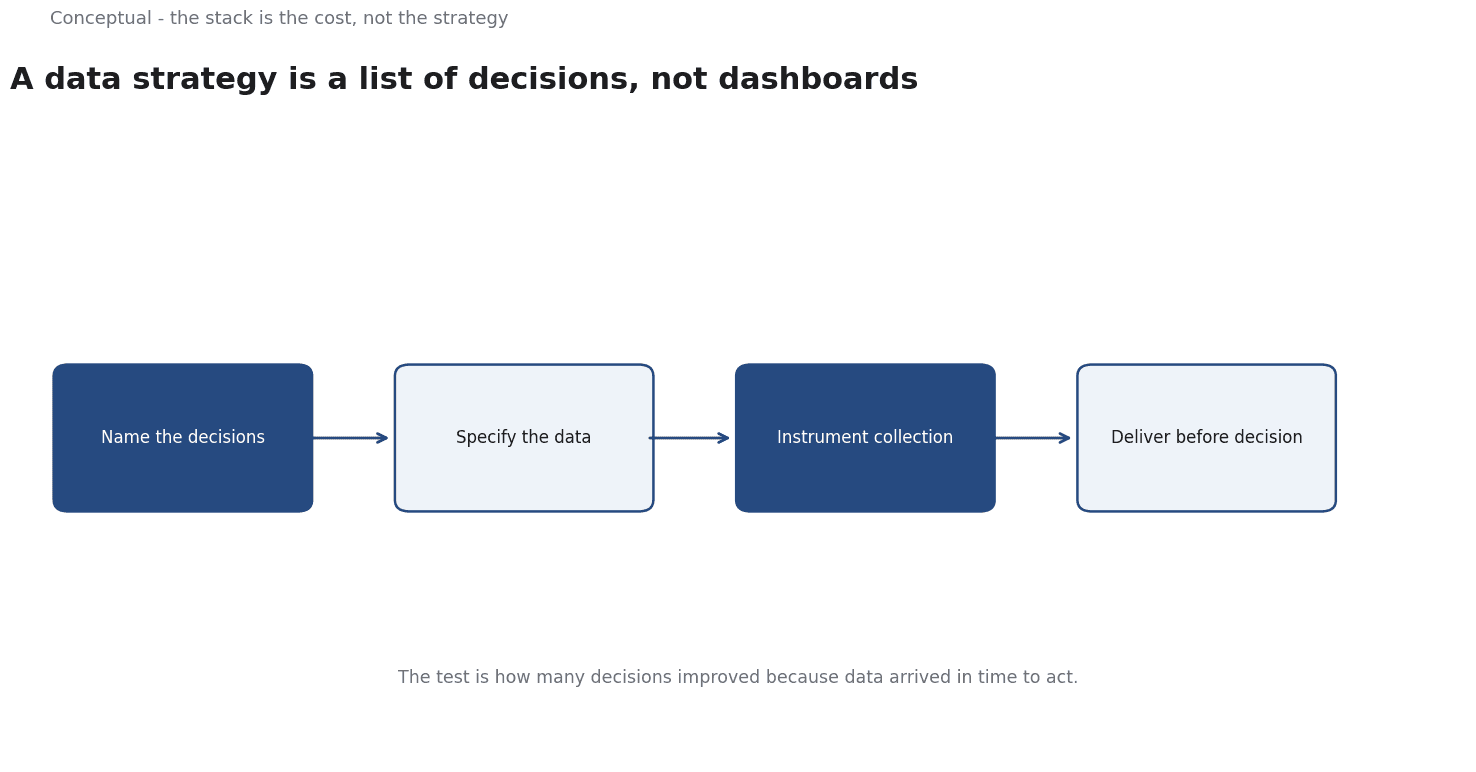
Start from decisions, not from data
An organisation surveys what data it has, catalogues it, and then asks what it could build. The resulting list is long and unrelated to any decision anyone makes, and it produces dashboards nobody opens.
The reverse order is short and hard. Start by listing the decisions that are currently made on gut feel, on a spreadsheet someone maintains manually, or on a quarterly meeting. For each one, ask what information would have to arrive, and when, for the decision to come out differently. Many of those questions will have an answer of "no information would change this" — which is a useful finding, because it identifies the decisions that are not actually decisions.
This exercise usually produces a striking result: a small number of decisions carry most of the value, and they cluster into a handful of rhythms. A demand-forecast decision that drives inventory, a pricing decision that must be made weekly, a retention decision that must be made before renewal, a capacity decision made a quarter ahead. Those clusters are where the instrumentation budget belongs.
The data has to arrive before the decision
The word "in time" is doing more work than it appears to. A dashboard that reports yesterday's numbers for a decision made this morning is not useful data; it is an accurate description of the past. The design constraint is latency against the decision cadence, and it is a different number for every decision.
This is where the gap between collecting data and using it becomes visible. Consider search visibility: Google Search Central's own documentation sets out what a site needs in order to be crawled and indexed — and the documentation is itself an example of the exercise. It names the specific signals a site must emit (crawlable pages, sitemaps, canonical signals, rendered content) so that the search engine's decision — whether to crawl, whether to index — can be made correctly. It is a statement about which decisions need which data, written by the party making the decisions.
The same pattern shows up in macro data, where the delay is published alongside the data. The Federal Reserve Bank of St. Louis's FRED database exists to make macro series available with their release dates attached, and the Bureau of Labor Statistics publishes a release schedule precisely so that consumers know when a number became knowable. Any organisation that builds a forecast on a series has to respect that publication delay, or it is modelling information nobody had.
The measurement you can actually trust
Before choosing platforms, there is a question that decides more than any tool: can you say, for each important decision, how you would know whether the data-based decision was better? Usually the honest answer is "we cannot tell", and that answer is worth having early.
Without it, "data-driven" degrades into "data-observed" — the decision is the same one that would have been made, with extra slides attached. That is not harmless, because it consumes budget and creates the appearance of rigour.
For workforce-facing decisions there is now an official baseline. The U.S. Census Bureau's Business Trends and Outlook Survey is the statistical agency tracking how businesses are actually using these technologies, which means a company arguing about its own AI adoption can check itself against a measured population rather than against anecdotes. Where such a baseline exists, use it; where it does not, the honest position is that the organisation is a data source rather than a data consumer.
The layer people forget: instrumentation
Much of a data strategy is a list of things that must be recorded rather than things that must be analysed. Whether a customer used the feature you built. When the renewal was agreed. What the support interaction actually was. Which experiment variant they saw.
This work is unglamorous and it is the part that determines whether the strategy is deliverable, because instrumentation is engineering work that competes for the same capacity as the products. And it is the part that decays silently: an event that stops firing, a pipeline that starts dropping a field, a dashboard nobody checks after a migration. Silent decay is worse than visible failure, because the report keeps arriving and slowly becomes untrue.
A way to write a data strategy that gets used
- Name the decisions. A short list, each with an owner and a cadence. If the list is long, it is a wish list.
- For each decision, name the information and the deadline. If the information would not arrive in time to change the decision, the decision does not belong on the list.
- Say how you will know it was better. A comparison, a holdout, a forecast error — something that can be wrong.
- Instrument what the decisions need, and keep it instrumented. Add a maintenance owner for the events, not just a builder.
- Check the baseline. Where an official statistic exists for your comparison, use it rather than your own impression.
- Review the list, and retire entries. A decision that no longer needs data should leave the strategy, and a decision that changed should enter it. A strategy that only grows is a backlog.
For the governance side — who owns data, and what happens when it is wrong — see Data Governance and Data Ethics.
A worked example
The following is hypothetical and illustrative. Suppose a retailer's "data strategy" is a catalogue of forty dashboards, and a review is asked to cut it to decisions. Check 1: name and deadline. Three decisions survive: a weekly price change, a demand forecast driving inventory, and a retention call before renewal. For each, the required information and its deadline are written down; the price decision needs competing prices by Monday morning, and a feed that lands Tuesday does not change that decision, so it is dropped. Check 2: know if it helped. Each remaining decision gets a test - a holdout for retention, a forecast error for demand - and the adoption baseline is checked against the cited official business survey rather than the team's own impression. Check 3: instrument and maintain. The events those decisions need are listed with a maintenance owner, and series publication delays are respected, since the cited macro database attaches release dates precisely so modellers do not use information nobody had. The outcome is bounded: two decisions remain, the other dashboards are retired, and the retention decision is revisited next quarter if its holdout shows no improvement.
A counterargument
The article defines value narrowly: data matters only when it changes a named decision. A reasonable critic would say this excludes the exploratory and shared uses that the cited sources actually model. Google's SEO guide describes signals a site emits so that a search engine - not the organisation - can decide what to crawl and index; on the article's test, that instrumentation has no decision to improve. FRED exists to make series available with their release dates attached, so that many consumers can make decisions the publisher never enumerated - an argument for shared data infrastructure beyond a short decision list. The Census Bureau's BTOS supplies an adoption baseline, but aggregate adoption cannot show whether any particular decision improved, which is the article's own measure of success.
Starting from decisions is a sound discipline for prioritisation, not a complete theory of where data creates value.
References & Further Reading
- Google, 2026. SEO Starter Guide: The Basics — The search engine's own description of what it needs from a site.
- U.S. Census Bureau, 2026. Business Trends and Outlook Survey — Official small-business AI adoption measurement.
- Federal Reserve Bank of St. Louis, 2026. FRED economic data — The primary time-series database used for macro indicators.