Data Visualization: Telling Stories with Numbers
A chart is a claim with a denominator. Read how to make the claim, its source, and its caveats legible instead of decorative.
Data visualisation advice tends to arrive as a list of chart-selection rules: use a bar chart for comparison, a line for time series, never a pie chart. Those rules are not wrong, and they are not the thing that decides whether a chart works. A correctly-chosen chart with a wrong denominator, an unexplained baseline, or an invisible source is still misleading, and it is more persuasive than a poorly-drawn one.
Direct answer: A visualisation makes an argument about a comparison, and it is only as good as the argument. The work is therefore not chart selection but claim hygiene: state what is being compared, against what baseline, over what period, with what denominator, and with what caveats — then choose the form that makes that argument visible. And because a chart is a published artefact, the choice about whether its underlying data is machine-readable is not an aesthetic decision.
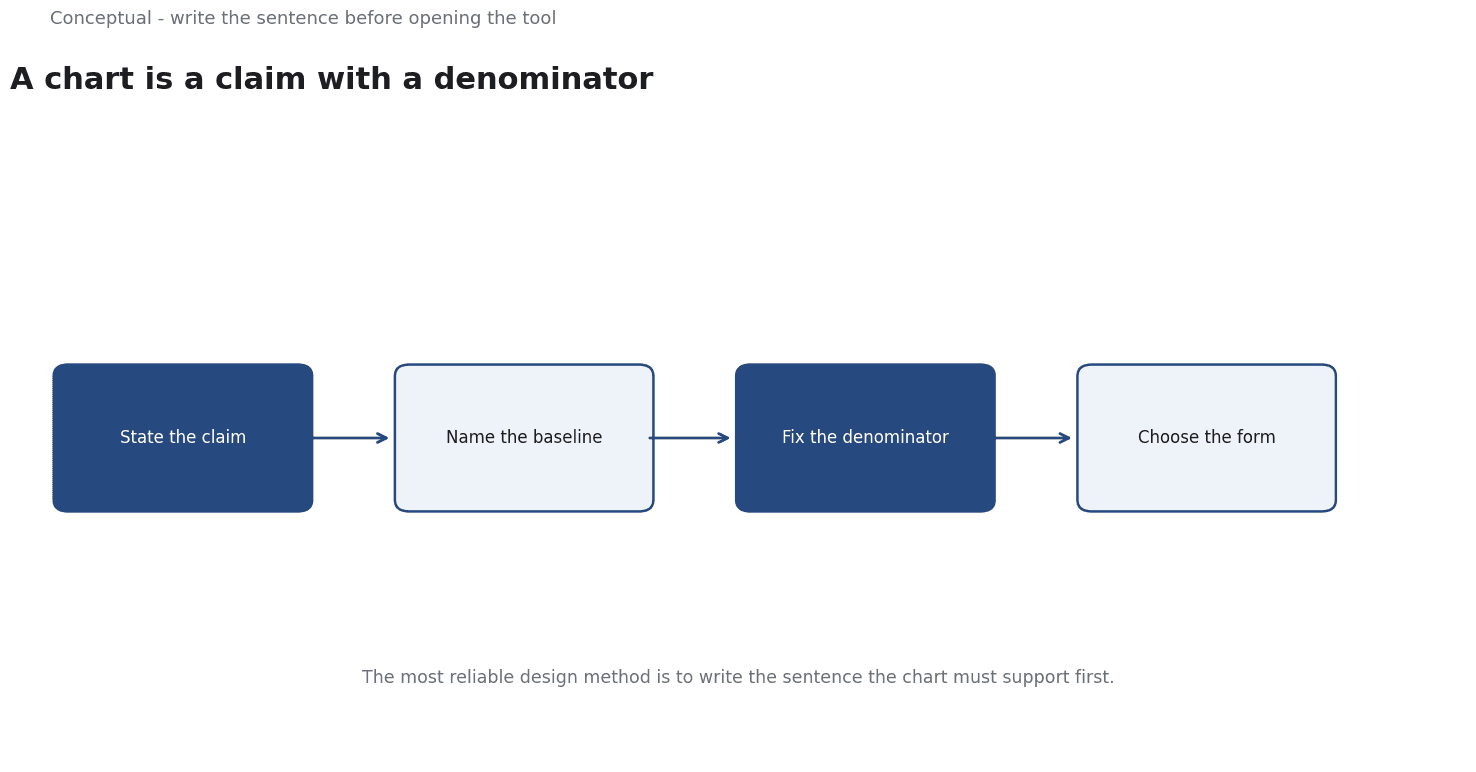
The claim comes before the chart
The most reliable way to design a chart is to write the sentence it is meant to support, before opening any tool.
"Revenue grew in every region except LATAM" is a claim. "Revenue by region, 2024 versus 2025" is a chart specification. The first one tells you what the audience needs to see and what would falsify it; the second one is a category error that leaves the audience to guess.
That sentence also forces the awkward questions early, and those are the questions that decide whether the chart is honest:
- Compared with what? A growth number means nothing without a prior period or a plan. A share means nothing without the denominator.
- Over what period, and is the period comparable? Year-on-year against a year with an extra trading day, month-on-month across a seasonal peak, daily against a period containing an outage — each of these silently inflates or deflates the number.
- Who is excluded? Averages hide the tail; totals hide the spread; filtered-out rows never appear on the chart.
- What would make this wrong? If nothing would, the chart is decoration. If something would, that something belongs on the chart or in the note.
The discipline of a dated, sourced series
The clearest example of this discipline in public data is macroeconomics. The Federal Reserve Bank of St. Louis's FRED database exists to make series available with their release dates attached, and the Bureau of Labor Statistics publishes a schedule of releases so that consumers know when a number became knowable rather than when it was measured.
That distinction matters for charts, not just for models. A chart of a series whose values have been revised contains a hidden layer: the version you plotted is not necessarily the version published at the time, and the revision history is itself information. Good macro charts state the vintage; good corporate charts should too, because internal data gets restated for entirely mundane reasons — a change in the customer definition, a correction, a reclassification.
There is a related point about the horizontal axis. The Bureau of Labor Statistics publishes its release calendar for a reason that is easy to miss: a revision to one month's figure can arrive after the next month's figure, so a series assembled carelessly can contain months that were never published in that order. Any chart built from dated sources should mark where the data was as-of.
Labels are writing, not decoration
A chart is read by people who will not reverse-engineer the measure. The axis title, the units, the period, the source, and the caveat are all part of the argument, and they are all written.
Published style guidance for technical and developer documentation treats this as a discipline rather than a preference — Microsoft's writing style guide, for instance, sets out voice, tone, structure, and terminology rules, on the principle that a reader should not have to guess what a piece of text means or how to act on it. The same principle applies to chart annotations: the subtitle that names the measure, the unit on the axis, and the note explaining the one-off that distorts the series.
The three practices that most improve a chart:
- Name the measure, not the series. "Monthly recurring revenue ($M, constant currency)" tells the reader what they are looking at; "MRR" does not.
- Mark the annotations that explain the shape. A regulation change, a price change, an outage, a product launch — an unexplained spike is an invitation to invent a cause.
- Put the caveat on the chart, not in the notes. A caveat in a footnote is a caveat that has been read by nobody.
The part most designers forget: the data has to be readable by machines
A dashboard published on the open web is consumed by two audiences, and only one of them is human.
Search engines and agents do not see a chart image. They see the document, the text around it, and whatever structured data the page exposes. This is why search documentation is unusually explicit about what a page must contain to be usable — a site that wants to be indexed has to make its content available in forms a crawler can actually read, including the text of what is on the page, not only a rendering of it.
The practical rule for visualisation: if a chart carries information that matters, the information must also exist as text or as structured data on the page. A table of the same series, a caption stating the finding, and an accessible description are not a compliance chore — they are what makes the artefact work for the growing share of readers and systems that read the data rather than the picture.
A checklist before the chart ships
- Write the claim in a sentence. If you cannot, the chart does not yet know what it is for.
- State the baseline, the period, and the denominator on the chart, not in your head.
- Use a dated, sourced series and note the vintage if the data has been revised.
- Annotate the points that explain the shape. An unexplained spike is a gap in the argument.
- Check the comparability of the periods — trading days, seasonality, one-off events, definition changes.
- Say what would make the claim wrong, and make sure the chart lets the reader see it.
- Publish the data as text or structured data, so the chart is usable by search engines, agents, and screen readers.
For how the numbers get assembled before they reach a chart, see Power BI for Business Analytics; for which decisions deserve a chart at all, see Data Strategy.
A worked example
The following is hypothetical and illustrative. Suppose an analyst is asked to chart monthly recurring revenue and reaches for a bar chart before stating the claim. Check 1: claim first. The sentence is written - revenue rose in every region except one, normalized for a currency shift - with the baseline, period and denominator named and the excluded rows listed; the analyst states what would falsify it. Check 2: series hygiene. The cited macro databases show why vintage matters, and BLS publishes a release calendar because a revision can arrive after the next month's figure, so the chart marks its as-of date and annotates the one-off spike rather than letting readers invent a cause. Check 3: labels and access. Following the cited documentation style guidance, the axis reads "MRR ($M, constant currency)" and the caveat sits on the chart; the same series is published as a table so crawlers and screen readers can read the data the image carries. The outcome is bounded: the chart ships with claim, baseline, vintage note and data table; a panel whose numbers cannot be published as text is withheld.
A counterargument
The article's central move - write the claim before the chart - assumes the chart exists to support a sentence already settled. A reasonable critic would object that charts are often used to find out what the sentence should be: an unexpected shape in a series is discovery, not decoration, and a pre-written claim can turn the plot into a device for confirming it. The cited sources do not resolve this in the article's favour. FRED is useful precisely because it exposes series whose interpretation the consumer supplies, and Google's SEO guidance about machine-readable text is about access for crawlers, not about whether a chart argues a case. The advice to put caveats on the chart rather than in notes is also asserted rather than demonstrated: placement alone does not guarantee that a reader attends to a caveat.
Claim hygiene is a real discipline, but treating every chart as advocacy narrows what visualisation is for.
References & Further Reading
- Federal Reserve Bank of St. Louis, 2026. FRED economic data — The primary time-series database used for macro indicators.
- Microsoft, 2026. Microsoft Writing Style Guide — A complete, published documentation style guide: voice, tone, structure, and terminology.
- Google, 2026. SEO Starter Guide: The Basics — The search engine's own description of what it needs from a site.