Demand Forecasting Metrics that Matter
A forecast is judged by the decision it supports, not one error score. Read the metrics, a worked example, and why the average hides the tail.
Demand forecasting is often evaluated with a single average error, which hides the cases that matter most. The demand-generation entry describes the stages before purchase, and FRED provides dated series. The metric should reflect the cost of being wrong in a particular direction.
Direct answer: Choose a metric from the decision the forecast supports, report the distribution of errors, and compare with a simple baseline. The sources provide context and data; the metric rule is a synthesis.
Delta: This article adds a claim-status table and a worked comparison, separating documented sources from the local choice of error measure.
The mechanism
Three points matter:
- Direction matters. Underforecasting a high-margin item costs a lost sale; overforecasting a perishable one costs waste. A symmetric error metric treats them alike.
- The average hides the tail. A forecast can be accurate on most days and badly wrong on a few, which are the days that cause stockouts or spoilage.
- A baseline is required. A complex model that cannot beat a seasonal average has not earned its cost.
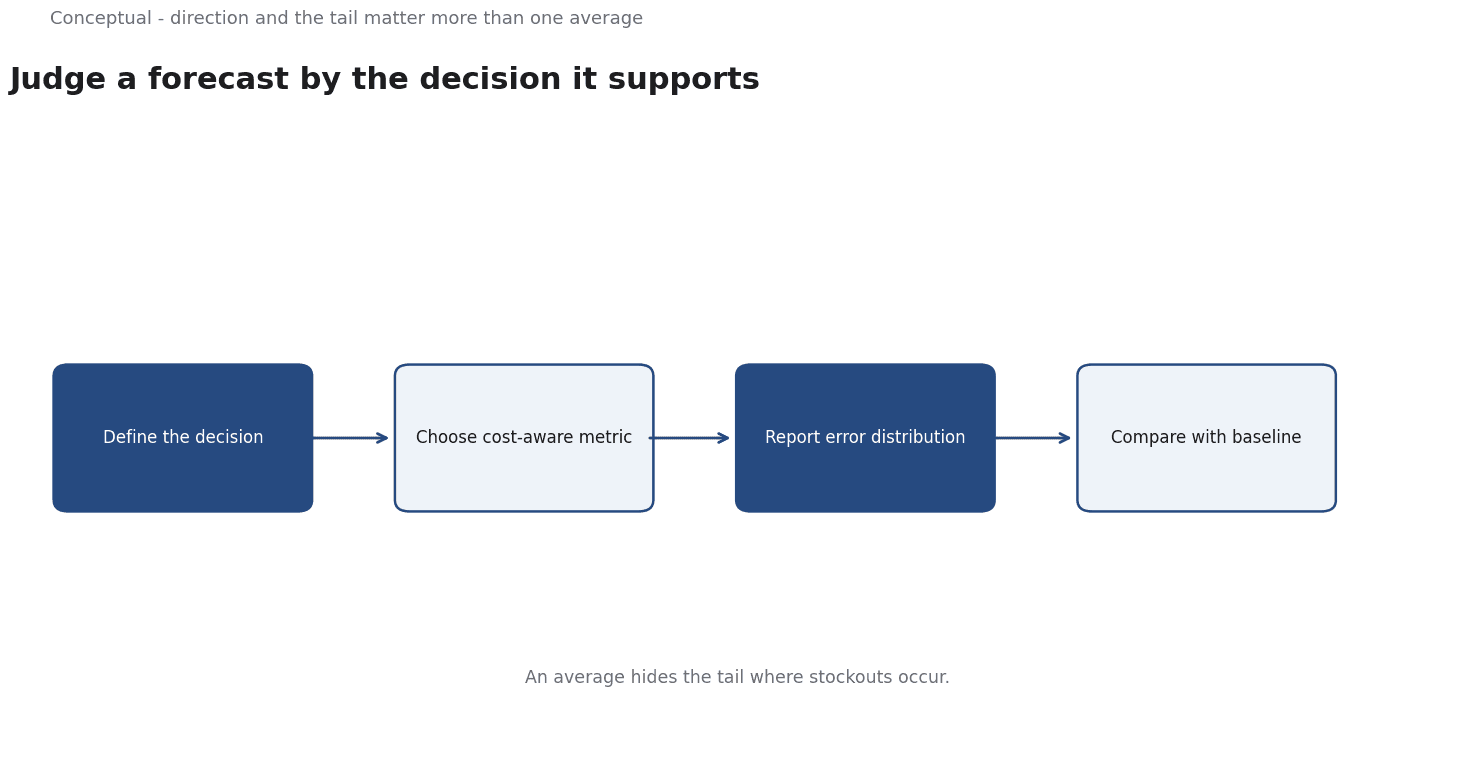
The sequence is: define the decision, choose a metric that reflects its cost, report the distribution, then compare with a baseline. The choice is local judgement, so it is inferred; the context is source-reported.
A worked example
Illustrative. A retailer forecasts weekly demand for a perishable item.
Three checks decide. First, which error is more expensive — too much stock or too little? Second, how large are the worst errors, not just the mean? Third, does the model beat a simple average of the last four weeks?
The outcome is a metric choice with a recorded rationale. The numbers are hypothetical; the method is the contribution.
Why the baseline is part of the metric
A forecast that beats a simple average is doing useful work; one that does not is adding complexity without value. The baseline should be chosen before the model, because selecting it after seeing the results invites a comparison that flatters the new approach. A seasonal average or a naive carry-forward is usually enough to start.
The second reason for a baseline is communication. Stating that a model reduces error by a fraction of a percent is abstract; stating that it reduces the worst stockouts by a third is concrete. Both describe the same system, but only one connects to the decision a planner makes.
Why direction belongs in the report
An error metric that treats overforecasting and underforecasting as identical hides the asymmetry of real costs. For a perishable item, too much stock becomes waste; for a high-margin item, too little becomes a lost sale. Reporting errors by direction lets the reader see which failure the model tends to make, which is often more important than the size of the average.
Evidence status
| Claim | Status | Source | Verified | Recheck when |
|---|---|---|---|---|
| Demand generation describes stages before purchase | source-reported | Wikipedia, Demand generation | 2026-11-18 | Definition revised |
| Dated economic series are available | source-reported | FRED | 2026-11-18 | Series changes |
| Choose a metric from decision cost | inferred | Derived from forecasting practice | 2026-11-18 | Cost structure changes |
Why the distribution matters
Two forecasts with the same mean can have very different tails, and the tail is where service failures occur.
Reporting percentiles or the count of large errors gives a clearer picture of the risk a planner will actually experience.
A final consideration is how the forecast is used. A metric that is good for evaluating a model in isolation may not be good for the person who must order stock. A planner needs to know the range of plausible demand and the consequences of each decision, not a point estimate presented as certainty. Publishing the distribution alongside the headline number makes the uncertainty visible and lets the decision reflect the cost of being wrong.
The data behind a forecast also has a date. A model trained on an older period can be reliable until a structural change makes the past a poor guide. Recording when the training data ended, and stating what change would invalidate the model, turns the forecast into a maintained artefact rather than a one-time result.
The chosen metric should be written down with the decision it serves.
What it cannot do
It cannot remove uncertainty, which belongs to the conditions the forecast describes. It does not guarantee that a better metric improves decisions, which still requires someone to act on it. And it cannot replace a baseline comparison.
The counterargument that a single metric is simpler is fair for reporting and incomplete for a decision with asymmetric costs.
A decision test
- Define the decision.
- State which error costs more.
- Report the distribution, not only the mean.
- Compare with a simple baseline.
- Use dated data.
- Record the metric rationale and recheck date.
For the method, see Time Series Forecasting.
References & Further Reading
- Wikipedia contributors, 2026. Demand generation - Wikipedia — An overview of demand generation as a marketing discipline distinct from lead generation; secondary reference used with the lead-generation entry.
- Federal Reserve Bank of St. Louis, 2026. FRED economic data — The primary time-series database used for macro indicators.