Email Marketing Metrics That Matter
Opens are noisy and clicks are partial. Read the metrics that connect a message to a decision, with a worked measurement example.
An email dashboard can show a 40% open rate and a growing list while the campaign does nothing for revenue. The metrics are not wrong; they measure intermediate events that are easy to inflate. Gmail's sender guidelines describe the reputation signals providers watch, and attribution guidance explains why reporting a credit rule is not the same as measuring an effect.
Direct answer: The metrics that matter are delivery and inbox placement, engagement quality, conversion to a defined outcome, and list health over time. Google's sender guidelines make reputation and list quality explicit; attribution guidance treats credit as a model, not a measurement. The boundary: no single email metric establishes incremental revenue — a holdout or matched comparison is needed for that, as Marketing Attribution: Multi-Touch Models, Incrementality, and Budget Allocation explains.
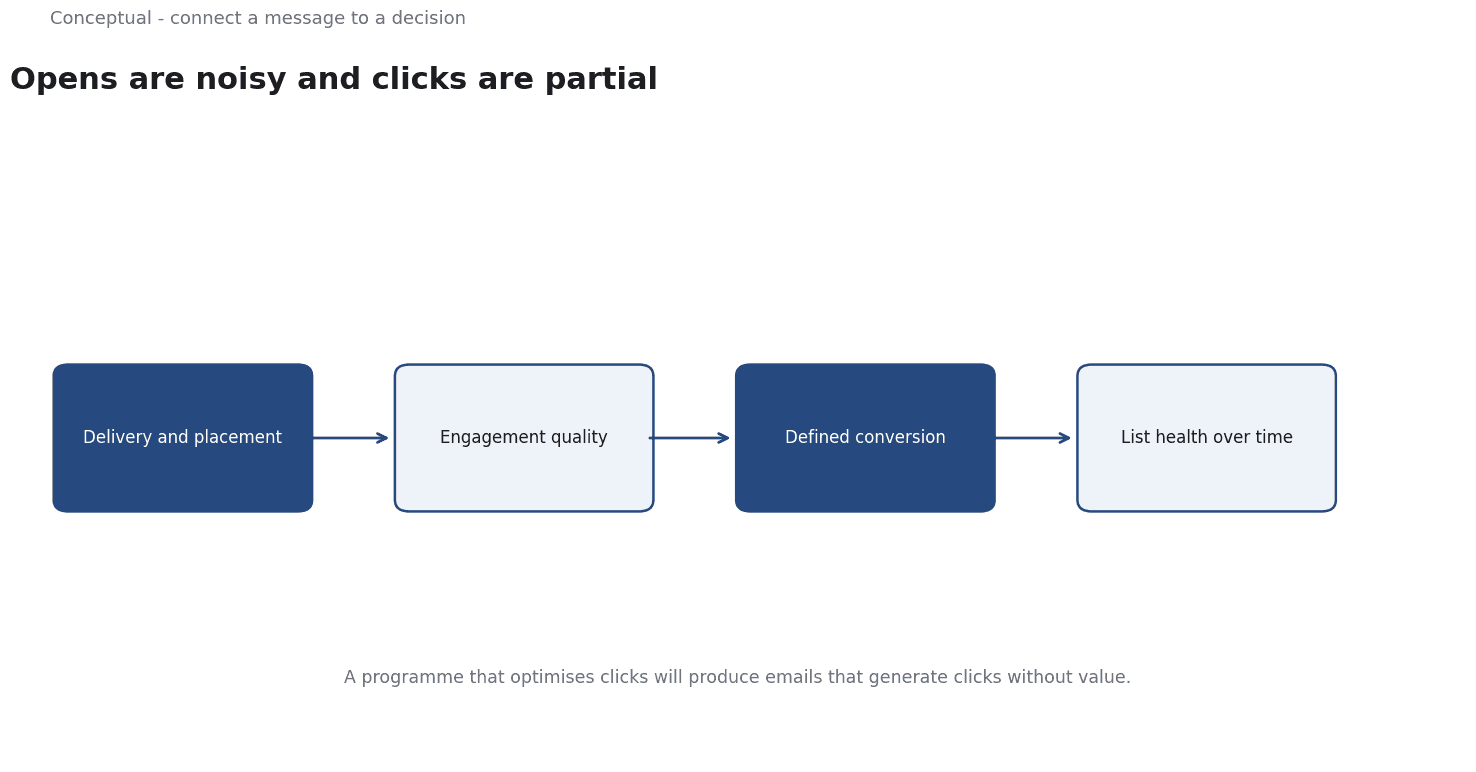
Four groups of metrics
Delivery and placement. Did the message reach the server, and did it land in the inbox rather than spam? These are distinct events. A sender with a stale list can have high delivery and poor placement.
Engagement quality. Clicks, replies, and time on the linked page. Opens are weaker because privacy features can register an open without a human reading. Use opens as a directional signal, not a target.
Conversion. Did the recipient do the thing the email was for — purchase, book, complete a form? The conversion must be defined per message, with a time window.
List health. Complaint rate, bounce rate, unsubscribe rate, and the share of subscribers who engaged in the last 90 days. These predict future deliverability, so they are leading indicators of a problem.
A worked example of reading a campaign
The following is hypothetical and illustrative.
A campaign is sent to 100,000 subscribers. The report shows:
- Delivered: 98,000. Inbox placement estimated at 82%.
- Opens: 30,000. Clicks: 4,000. Purchases attributed to clicked links: 200.
- Complaints: 120. Hard bounces: 1,500. Unsubscribes: 300.
Three questions decide whether this is good:
- Is placement a problem? 18% in spam means roughly 17,600 messages may never be seen. Improving list hygiene could recover more reach than rewriting the subject line. The sender guidelines are the reference for what providers reward.
- Is the list decaying? 1,500 hard bounces on 100,000 is 1.5%. If the same rate persists, the list will bleed deliverability over time. A suppression rule for repeated bounces is a control, not an option.
- What did the campaign cause? 200 attributed purchases is a credit rule — it gives the email credit because the buyer clicked. Without a holdout, some of those purchases would have happened anyway. The incrementality question needs a comparison group.
Three decisions follow:
- Fix placement before optimising copy. The larger gain is in reach.
- Track list health as a trend, not a one-off figure.
- Label attributed conversions as attribution, not incremental lift.
Choosing a primary metric
Different email programmes should optimise different numbers:
Retention emails — a primary metric of retained customers or repeat purchase, with engagement as a leading signal.
Acquisition emails — qualified conversions with a defined window, not raw signups.
Newsletters — a combination of engaged readership and a downstream action; open rate alone rewards subject-line tricks.
A programme that optimises clicks will eventually produce emails that generate clicks without value.
The metric shapes the content, so choose it deliberately.
Choosing a reporting rhythm
Different metrics deserve different review cadences, and mixing them causes bad decisions. Three rhythms work in practice:
Per send. Delivery, placement, clicks, and the defined conversion belong in the report for each campaign. These move quickly and tell you whether the message worked. A weekly or per-send review catches a deliverability problem before it becomes a reputation problem.
Monthly. Complaint rate, bounce rate, and the share of engaged subscribers are leading indicators of list health. They change slowly enough that a monthly view is useful, and quickly enough that a decline can still be addressed.
Quarterly. List composition, cohort engagement, and the relationship between email-driven actions and downstream revenue deserve a longer window. A quarterly review can ask whether the programme is attracting the right subscribers at all, which a per-send report cannot answer.
A team that reviews only quarterly will notice a deliverability collapse too late. The rhythm is a control in itself.
What the metrics cannot show
Attribution is not causation. A purchase after a click is correlated with the email; a holdout is needed to estimate what would have happened without it.
Opens are unreliable. Privacy features, image preloading, and mail clients distort the signal. Treat a change in open rate as a question, not a result.
Benchmarks are context-dependent. A comparator from another industry with a different list and cadence is not a target. Use your own history as the baseline.
The counterargument — that teams need simple numbers to manage by — is fair. The response is to pick one primary metric per programme and keep the others as diagnostics.
Simplicity comes from selection, not from ignoring the problem.
A decision test
- Define the outcome the email is meant to produce and its time window.
- Measure placement separately from delivery.
- Treat opens as directional, never as a target.
- Track complaints, bounces and inactivity as leading indicators.
- Label attributed conversions as attribution, not lift.
- Use a holdout when the spend is material.
- Compare against your own history, not a generic benchmark.
For the deliverability mechanics, see Email Deliverability; for the measurement distinction, see Marketing Attribution.
References & Further Reading
- Google, 2026. Email sender guidelines - Gmail Help — A major mailbox provider's published sender requirements and bulk-sender recommendations.
- Google Ads Help, 2026. About attribution models - Google Ads Help — First-party documentation of attribution models and their limits.