Experimentation Platforms Pitfalls
Experimentation platforms promise clean tests but hide bias, peeking, and metric traps. Read the limits, a worked example, and a decision test.
Experimentation platforms make it easy to launch a test and read a result, which is why teams treat the output as a verdict. The Wikipedia entries on experiment and A/B testing describe controlled comparison, but a platform report can look conclusive while the underlying comparison is biased. The real problem is that the interface hides design choices, and those choices decide whether the lift is real.
Direct answer: Treat an experiment as a controlled comparison whose validity is established before the result is read, not after. The sources define the experiment and the randomized A/B test; the pre-launch checks they imply are a synthesis. A platform reports a number, but the design determines whether that number supports a decision.
Delta: This article adds a design-validity checklist beyond the sources: it maps each platform setting to a review decision, with claim status explicit.
The mechanism
The Wikipedia experiment entry describes a controlled procedure for testing a hypothesis, in which variables are manipulated and outcomes are measured. A/B testing narrows that idea to two variants assigned to users at random, with a metric used to compare them. The practical consequence is that randomization is what makes the comparison interpretable. If assignment is not random, a difference in the metric may reflect who happened to land in each group rather than the change being tested, and no amount of reporting polish fixes that.
Platforms automate assignment, sample size, and significance reporting, which creates the impression that the method executes itself. The sources describe design requirements, not software features. When a platform stops a test as soon as a threshold is crossed, it changes the error properties of the significance calculation. The practical consequence is that the reported number no longer means what the textbook definition says, because repeated looks at accumulating data raise the chance of a false positive. The interface shows a badge, not the condition under which the badge is trustworthy.
Metric choice is another design decision hidden by the interface. A/B testing compares a defined outcome, but a platform will compute dozens of metrics, and the largest apparent lift among them is likely to be noise. The practical consequence is that a team which selects the winning metric after the test has not run one experiment but many, with a correspondingly raised chance of a false finding. The metric should be declared before launch, and every other metric treated as a diagnostic rather than a verdict.
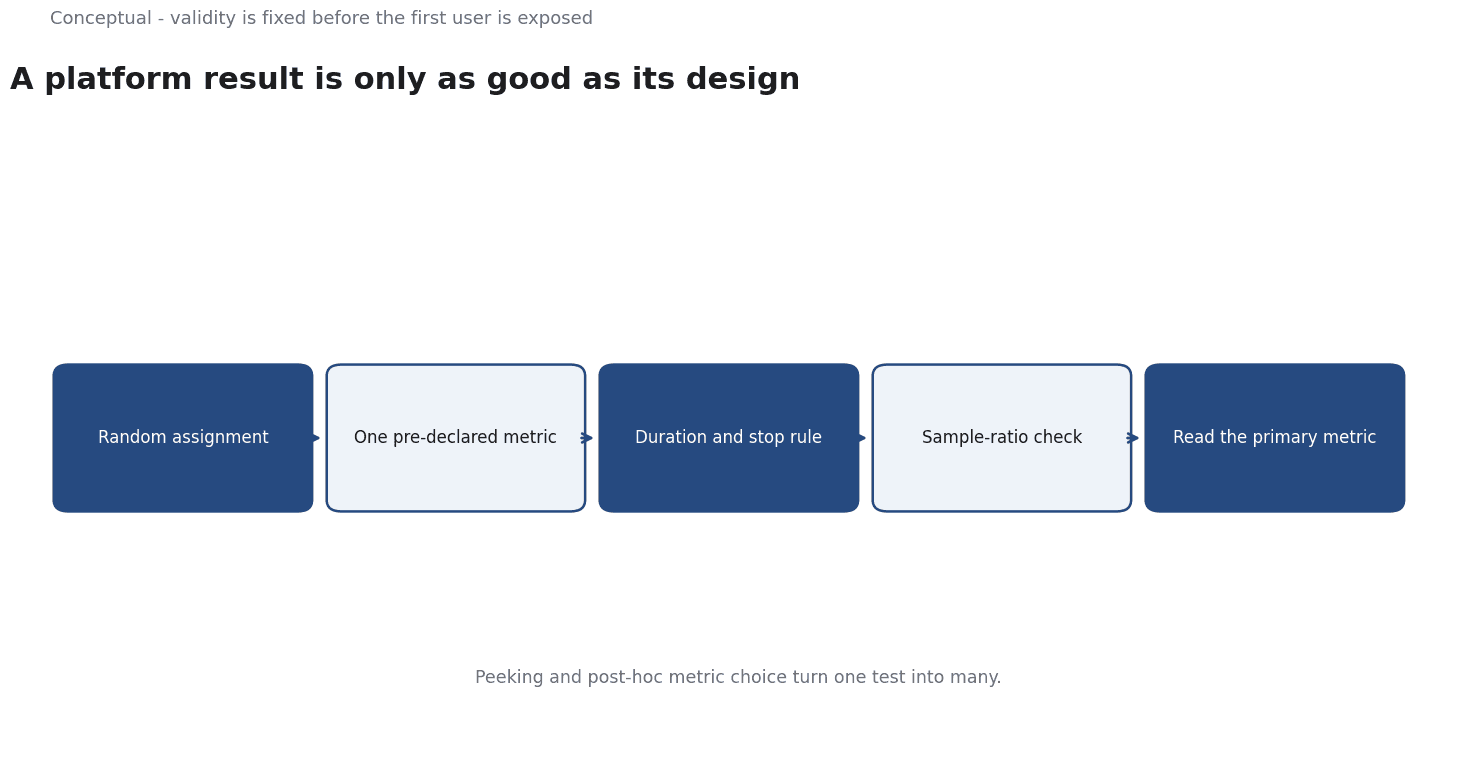
Taken together, these points mean the platform is a measurement instrument with configuration, not an oracle. Validity comes from choices made before the first user is exposed: random assignment, a single pre-declared primary metric, a fixed duration, and a stopping rule set in advance. None of these is supplied by the sources as a platform requirement; they are the conditions under which a controlled comparison means what it claims. The useful output is therefore a mapping from each platform setting to a decision that a reviewer can inspect.
A worked example
The following is hypothetical and illustrative. A team tests a new checkout button with an experimentation platform and expects a clear lift. Three checks decide whether the result is trustworthy. First, an assignment check: were users randomly assigned, with no routing rule that sent mobile users to only one variant? Second, a metric check: was a single primary metric declared before launch, rather than chosen as the largest lift on a dashboard afterward? Third, a stopping check: did the test run its planned duration, or was it halted the first day the significance badge turned green? The platform reports a modest lift in the pre-declared metric after the planned sample size was reached, and the sample-ratio check shows balanced groups. The outcome is a decision to ship, made only after the three checks passed. The numbers are hypothetical; the verification method is the contribution.
Evidence status
| Claim | Status | Source | Verified | Recheck when |
|---|---|---|---|---|
| An experiment tests a hypothesis under controlled conditions | source-reported | Wikipedia, Experiment | 2026-11-18 | Definition revised |
| A/B testing compares two variants assigned at random | source-reported | Wikipedia, A/B testing | 2026-11-18 | Entry revised |
| Peeking and post-hoc metric choice weaken validity | inferred | Derived from the sources | 2026-11-18 | Platform defaults change |
The first two rows are factual claims drawn directly from the sources. The third is an inference, because neither entry addresses when a platform stops a test or how a metric is selected. Recheck the source claims when the entries are revised, and the inferred claim when platform defaults or traffic patterns change.
What it cannot do
An experimentation platform cannot tell a team that its hypothesis was worth testing. It can show that a variant changed a metric under the conditions that were configured, but it cannot tell you whether that metric matters to the business or whether the effect will persist after rollout. The sources define controlled comparison and randomized assignment; they make no claim about business value. A statistically clean result on an unimportant metric is still an unimportant result, and the platform has no way to flag that.
The hidden cost is operational discipline. Running clean experiments needs a pre-registration habit, a sample-size calculation, and a review that happens before launch rather than after. Teams that skip this work get faster-looking results and more wrong decisions, because the speed comes from skipping the checks that give the number meaning. The cost is paid in attention and in the willingness to delay a read, not in software licensing. Small teams often feel this cost most, since the same people design, launch, and interpret the test.
A dashboard that can be refreshed at any moment invites an early read, and an early stop inflates false positives beyond the rate the report implies. A second failure mode is sample-ratio mismatch, where assignment drift makes the two groups dissimilar and the comparison silently breaks. A third is the multiple-metric trap, in which the largest lift is reported without noting how many metrics were examined. All three are invisible in a headline lift number, which is why they need checks that sit outside the dashboard.
There is a boundary around what a result covers. An A/B test measures the effect of a change on a defined population over a defined window, under the traffic mix that was present during the test. It says little about long-term retention, novelty effects, or segments too small to detect. A win during a test can reverse after rollout when the audience changes or the novelty fades. The platform does not model that, and a result that looks definitive in the report should still be framed as an estimate with a scope.
Because defaults and traffic change, the test setup needs periodic review. Assignment logic, metric definitions, duration, and stopping rules should be owned by a named party with a recorded recheck condition. Without that record, a future reviewer cannot tell which settings were deliberate and which were convenient defaults, and the same validity mistakes recur. The configuration and the policy that governs it must be revisited together, since changing one without the other recreates the gap the checks were meant to close.
The counterargument that a platform makes experiments accessible is fair for lowering setup effort and incomplete when default settings silently change the validity of the result.
A decision test
- Write the hypothesis and one primary metric before launch.
- Confirm random assignment with no routing rule that biases groups.
- Set the sample size and planned duration in advance.
- Fix a stopping rule and disable automatic early stopping.
- Check sample-ratio match before reading the result.
- Read only the pre-declared metric, not the largest lift.
- Record the settings, an owner, and a recheck date.
A platform result is only as trustworthy as the design behind it.
This test turns a dashboard number into a sequence of checks a reviewer can audit, so a decision rests on validity rather than on the confidence the interface conveys. For further reading, see Decision Memos That Survive Review.
References & Further Reading
- Wikipedia contributors, 2026. Experiment - Wikipedia — Controlled procedure to test a hypothesis.
- Wikipedia contributors, 2026. A/B testing - Wikipedia — Controlled comparison of two variants.