Factor Investing: Value, Momentum, and Their Limits
Factors describe persistent return patterns, not laws. Read what the evidence supports, a worked comparison, and why premiums can vanish.
Factor investing tries to capture systematic patterns in returns — value, momentum, size, quality — rather than pick individual companies. The evidence for these patterns is extensive, and so is the evidence that they are unstable, crowded, and sensitive to how they are measured. A factor is a description of past behaviour, not a guarantee of future returns.
Direct answer: Factors are characteristics associated with different average returns in historical data, and a factor strategy tilts a portfolio toward them. The valuation overview distinguishes sources of return, and FRED provides dated series for testing assumptions. The boundary: a factor premium can shrink or reverse when the strategy becomes crowded or when the underlying economic explanation changes, which the behavioural-finance article treats as a question of whether the pattern reflects risk or behaviour.
Why factors are not laws
A factor is a pattern in historical data, and the first question about any pattern is whether it will persist. The economic explanation matters: if a premium compensates for a real risk that investors cannot easily bear, it may be durable; if it reflects a behavioural quirk that arbitrageurs can exploit, it may shrink as more capital arrives, which the behavioural-finance article treats as a question of market participation. Most factors have elements of both, which is why their future size is uncertain.
Measurement choices also matter more than the label. A value factor defined on book value behaves differently from one defined on earnings or cash flow, as the earnings-quality article explains for how a number is constructed. Two funds claiming the same factor can hold different portfolios and produce different results, which the comparable-company article treats as a selection problem.
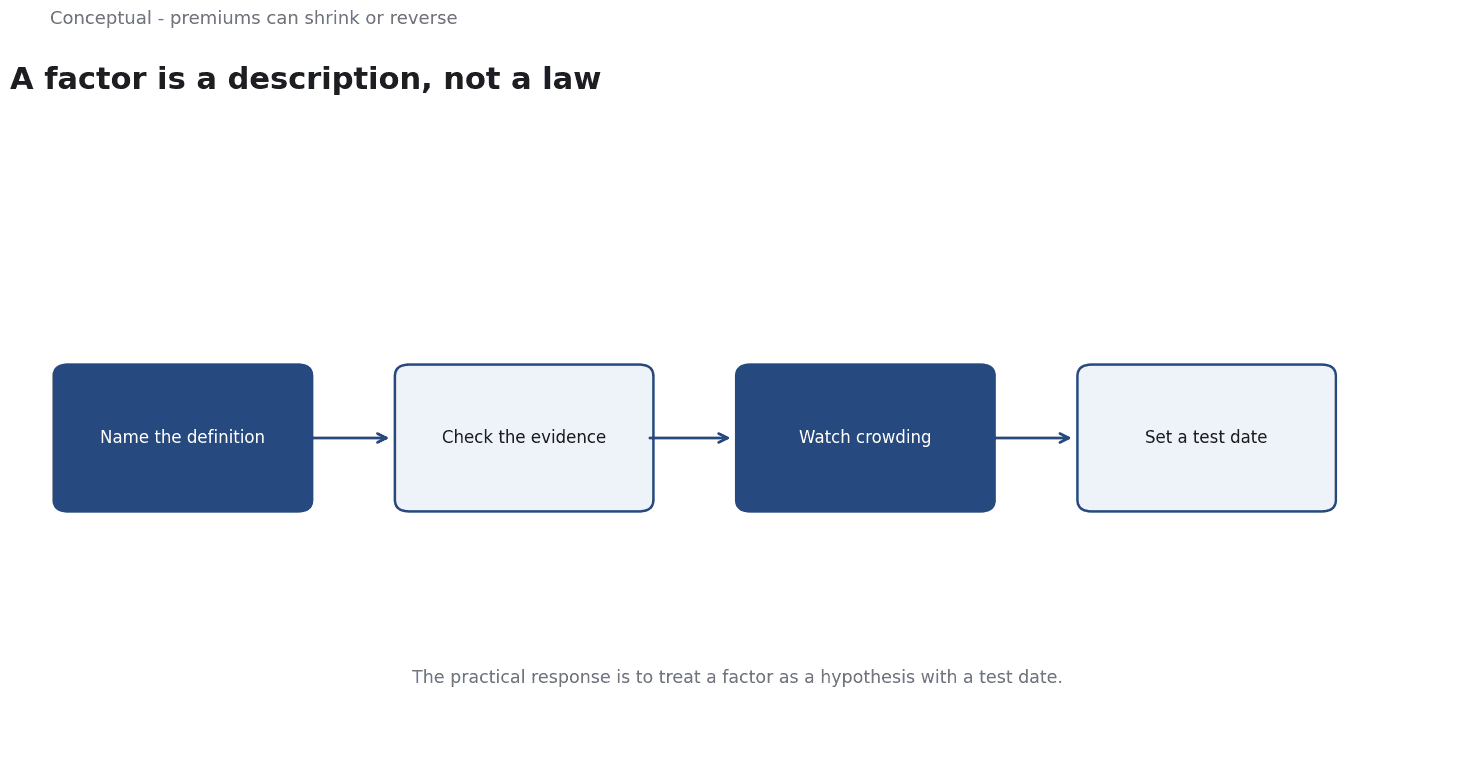
The practical response is to treat a factor as a hypothesis with a test date.
State what the pattern is, why it might persist, what would falsify it, and when you will re-check, as the risk-assessment article recommends for any maintained belief. An investor who can articulate those four things is in a different position from one who owns a factor fund because it sounds rigorous.
What the factors claim
Value — stocks that look cheap on measures such as earnings or book value have historically earned higher returns. The explanation is debated: compensation for risk, or a behavioural overreaction, as the behavioural-finance article treats cognitive biases in markets.
Momentum — assets that have performed well recently tend to continue performing well over intermediate horizons. It is robust in data and notoriously prone to sharp reversals, which the financial-crises article treats as a regime-change problem.
Quality and size — profitable, stable companies and smaller companies have shown different average returns, with explanations that range from risk to data quality, as the comparable-company article treats selection and adjustment problems.
Three consequences follow. Factors overlap — a stock can score on value and quality at once — which the correlation-vs-causation article treats as a reason not to treat them as independent bets. Measurement choices change results, as the earnings-quality article explains for how a number is constructed. And a published premium is an average, not a predictable annual return, which the sensitivity-analysis article recommends testing as a range.
A worked comparison
The following is hypothetical and illustrative. An investor compares a broad market fund with a value-tilted version over twenty years.
The broad fund returns 8% annually with a certain level of volatility. The value tilt returns 9% annually on average but underperforms in five consecutive years in the middle of the period. Three checks decide whether the tilt is suitable. First, is the one-point average difference robust to different value definitions, which the earnings-quality article treats as a measurement question? Second, can the investor hold through five bad years, which the behavioural-finance article treats as a real constraint, as the asset-allocation article frames tolerance? Third, are the costs of the tilted fund higher, which the cost estimator treats as a certain drag against an uncertain premium?
Three conclusions follow. The average alone does not decide the strategy, as the valuation article argues for explicit assumptions. The path matters as much as the endpoint, which the long-horizon article treats as sequence risk. And the decision should be recorded with its reasoning, as the decision-memo article requires.
What factors cannot do
They cannot guarantee a return, which investor education states explicitly. They cannot remove the need for diversification, which the ETF article treats as the baseline before any tilt. And they do not settle the question of why a pattern exists, which the causal-inference article treats as separate from observing it.
The counterargument that factor premiums have been arbitraged away is possible and unfalsifiable as a slogan.
The practical response is to test the assumption on current data with stated definitions, as the financial-modeling article recommends for explicit models.
A decision test
- Define the factor and its measurement precisely.
- Check the evidence with dated data from a primary source.
- Test sensitivity to different definitions, as the earnings-quality article advises.
- Assess whether the investor can hold through underperformance.
- Compare costs against a broad baseline, as the cost estimator requires.
- Avoid treating factors as independent bets, as the correlation article warns.
- Review the assumption when the evidence changes, as the monitoring article advises.
For the behavioural context, see Behavioral Finance; for the baseline, see ETF vs Individual Stocks.
References & Further Reading
- Wikipedia contributors, 2026. Valuation (finance) - Wikipedia — Overview of absolute and relative valuation approaches; secondary reference.
- Federal Reserve Bank of St. Louis, 2026. FRED economic data — The primary time-series database used for macro indicators.