Fiscal Policy in Practice
Fiscal policy uses government spending and taxes to influence the economy. Learn the mechanism, a worked reading of indicators, and the limits of the data.
Fiscal policy is often discussed as if a single indicator proves whether it worked, but the tools that describe policy and the data that track outcomes answer different questions. The fiscal policy entry describes the use of spending and taxation, and FRED provides economic time series. The real problem is connecting a policy concept to data that can actually inform a judgement.
Direct answer: Fiscal policy is the use of government spending and revenue collection to influence economic conditions, typically described as expansionary or contractionary. FRED supplies time series such as output and employment that can be used to observe the economy. A claim about policy works only when the indicator matches the mechanism being discussed.
Delta: This article adds a claim-status table and a policy-to-indicator mapping beyond the sources: it maps a fiscal stance to an observable economic series, with claim status explicit.
The mechanism
The fiscal policy entry describes how a government uses spending and taxation to influence the economy. When spending rises or taxes fall, the stance is described as expansionary; when spending falls or taxes rise, it is contractionary. The source presents these as tools for affecting demand and economic activity. The key point for practice is that fiscal policy is a stance made of flows over time, not a single event, so evaluating it requires looking at what changed and when.
FRED, maintained by the Federal Reserve Bank of St. Louis, is a database of economic time series drawn from many sources. Series such as gross domestic product, employment, and prices let an observer track conditions that fiscal policy is intended to affect. The tool supplies observations, not explanations: a series can show that output grew after a spending change, but it cannot by itself attribute that growth to the policy. The sources therefore occupy different roles, one conceptual and one empirical.
The consequence is that practical analysis links a policy stance to a matching indicator. If the claim concerns demand, an output or employment series is relevant; if it concerns prices, a price series is more appropriate. The sources do not specify which series to pair with which claim, so selecting an indicator is an inference. That choice should be recorded, because two analysts using the same data can reach different conclusions simply by choosing different series or periods.
A further consequence is that indicators move for many reasons. A change in output can reflect monetary conditions, trade, or private behavior as well as fiscal decisions, and time lags blur the connection between a policy action and an observed outcome.
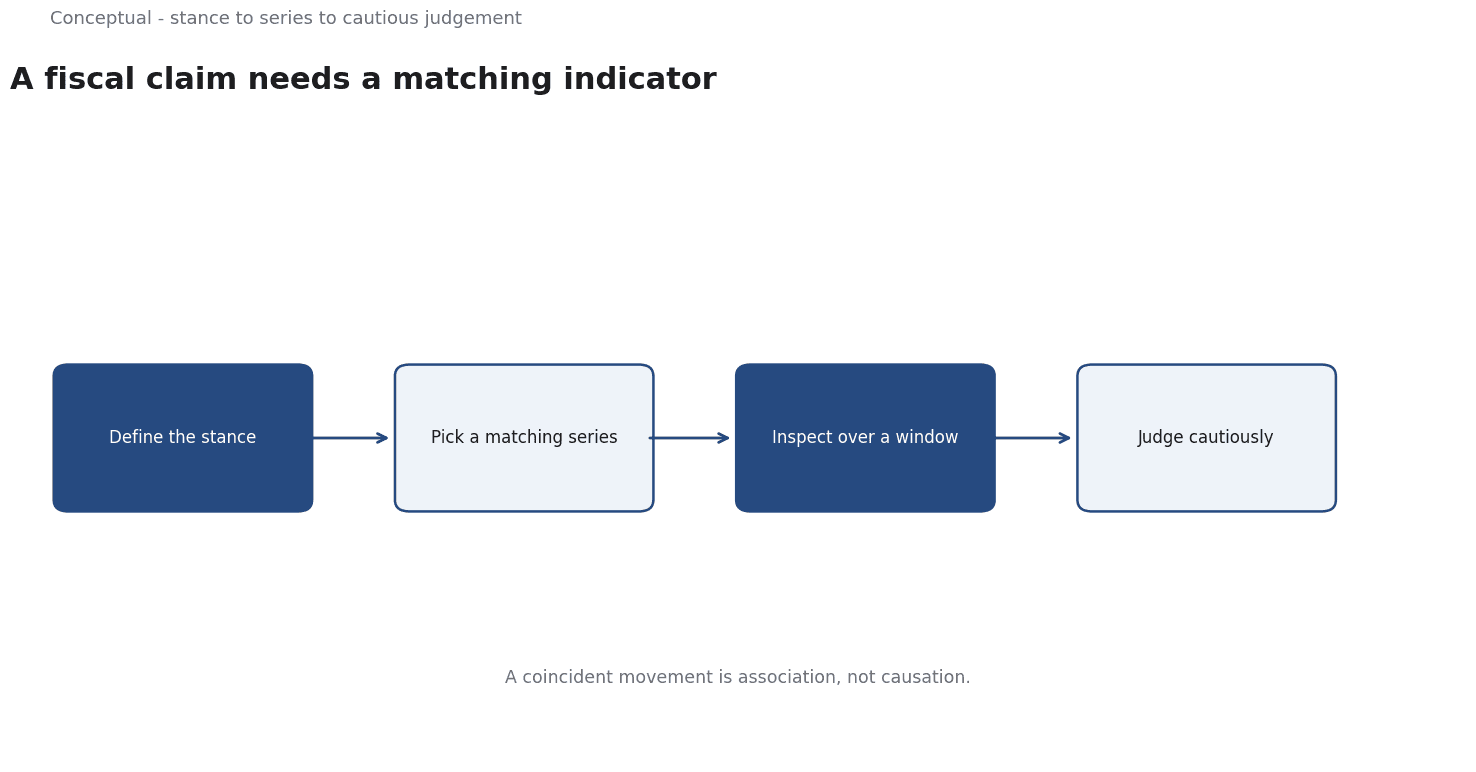
The mechanism is therefore a chain: define the fiscal stance, choose an indicator that corresponds to the intended effect, inspect the series over a relevant window, then judge cautiously.
Every link is a decision that should be visible when a conclusion is drawn.
A worked example
The following is hypothetical and illustrative. An analyst wants to assess whether an increase in government spending coincided with stronger economic activity. Three checks shape the work. First, the analyst defines the policy stance precisely, stating what changed, when, and in what direction. Second, a matching indicator is chosen from available time series, selected because it reflects the intended effect rather than because it happens to look favorable. Third, the analyst checks the timing, asking whether the observed change came after the policy and whether other conditions could explain it. The checks show a coincident rise in the indicator but also a confounding change in another condition, so the analyst reports association rather than causation. The figures are hypothetical; the verification method is the contribution.
Evidence status
| Claim | Status | Source | Verified | Recheck when |
|---|---|---|---|---|
| Fiscal policy uses spending and taxation to influence the economy | source-reported | Fiscal policy - Wikipedia | 2026-11-18 | Definition revised |
| FRED provides economic time series for observation | source-reported | FRED economic data | 2026-11-18 | Series or coverage changes |
| Match the indicator to the claimed policy effect | inferred | Derived from the sources | 2026-11-18 | Claims or series change |
The first two rows restate what the source entries present and can be checked directly. The third row is a synthesis, because neither source tells an analyst which series to pair with a given policy claim. Recheck the source rows if the entries change, and recheck the inferred row when the claim or the available series changes.
What it cannot do
Fiscal data and economic series cannot prove that a policy caused an outcome. They can show that a stance changed and that an indicator moved, but many forces shape the economy at once, and the sources do not provide a method for isolating one cause. A claim that spending caused growth needs an identification strategy that these references do not supply.
An analyst who ignores this will attach a confident story to a pattern that may be coincidental.
The hidden cost is the judgement required to choose series, periods, and comparisons. FRED contains many series, and a selective choice can make a weak case look strong. There is also a cost to aggregation: a national average can hide different experiences across regions or groups, so a policy that helped one area while hurting another can appear neutral in the headline number. Neither source addresses these choices, so they remain inferences that should be made explicit rather than buried in a chart.
The main failure mode is ignoring timing and lags. Fiscal actions take time to affect activity, and an indicator may move before, during, or well after the policy window. Choosing a window that flatters the conclusion is easy and hard to detect without a stated rule. A related failure is treating revisions to data as noise: economic series are often revised, so a conclusion drawn from an early estimate can weaken when the final figures arrive. The sources give definitions and data, not protection against either mistake.
There is a boundary around what these references cover. The fiscal policy entry describes a class of tools; it does not settle debates about size, timing, or effectiveness in a particular case. FRED supplies observations; it does not build models or assign causation. An analysis built from both can describe a stance and track conditions, but it cannot decide whether a policy was worth its cost or how it compares with alternatives. Those questions need tools and judgements outside the sources, and pretending otherwise overstates what the data can support.
Because series and policy stances change, the analysis needs periodic review. Indicator definitions, coverage, and revisions should be checked before a series is cited, and the chosen window should be compared against alternative windows to test robustness. Each conclusion should record the stance, the series, and the period used, so it can be challenged rather than inherited. Without that record, an old reading of the data keeps shaping current claims.
The counterargument that a clear indicator is fair because it makes a complex policy legible is reasonable for communication and incomplete for causation, since a single series cannot separate policy effects from other forces.
A decision test
- Define the fiscal stance, including what changed and when.
- State the effect the policy is supposed to have.
- Choose an indicator that corresponds to that effect.
- Check the series definition, coverage, and revision status.
- Inspect timing and consider alternative windows.
- Name other forces that could explain the movement.
- Record the stance, series, and period with the conclusion.
Fiscal analysis is defensible when the indicator matches the claimed mechanism and the limits of the data are stated. The test keeps that link visible, so a conclusion is supported by a defined series and a cautious reading rather than by a convenient chart. For further reading, see Responsible AI: Ethics, Fairness, and Regulatory Compliance.
References & Further Reading
- Wikipedia contributors, 2026. Fiscal policy - Wikipedia — Government use of spending and taxation.
- Federal Reserve Bank of St. Louis, 2026. FRED economic data — The primary time-series database used for macro indicators.