How to Build a Marketing Funnel From Scratch
A funnel is a set of decisions about stages and measurement. Read the five stages, a worked example, and where most funnels break.
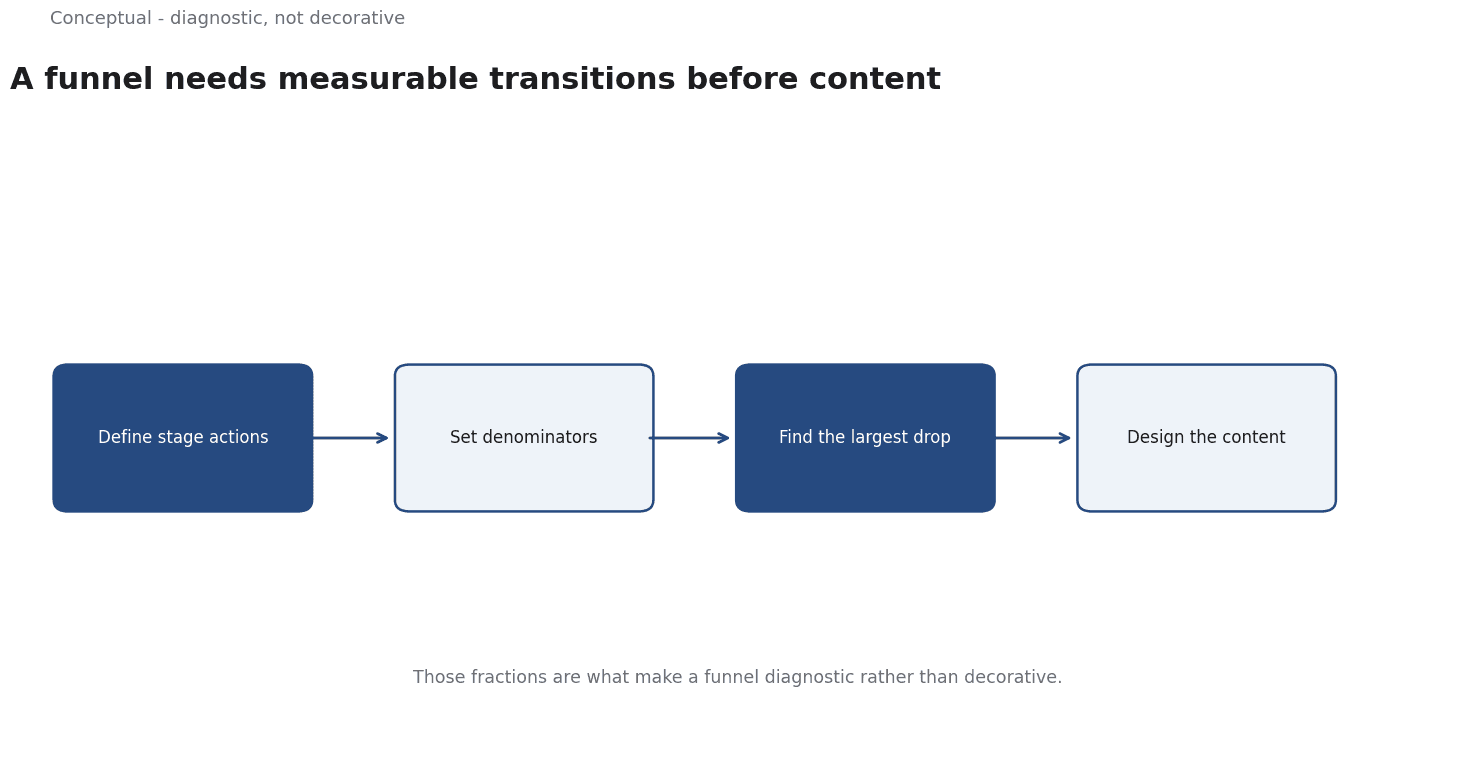
A funnel diagram is easy to draw and easy to misuse. The boxes — awareness, interest, consideration, conversion, retention — describe a customer's journey, but a diagram does not tell you which stage your business actually loses people at. Building one from scratch means defining the stages with measurable transitions before designing the content for them.
Direct answer: A useful funnel defines each stage by an observable action and a metric with a denominator, then identifies the largest drop between stages. Demand generation builds preference before a buyer is ready; lead generation captures contact details. Geo experiments offer a way to test whether a stage intervention caused a change. The boundary: a funnel is a model of a journey, not the journey — customers skip stages, return, and arrive through channels the diagram does not show.
Five stages with measurable actions
Awareness — the person can name you when a need arises. Measure with branded search and direct traffic, not reach alone.
Interest — a repeat visit, a subscription, or a meaningful engagement. Define the action that distinguishes interest from a single accidental visit.
Consideration — the person compares you with alternatives. Measure product-page depth, demo requests, or time spent with evaluation content.
Conversion — the defined outcome: a purchase, a signed contract, a completed signup. State the time window.
Retention — repeat purchase or continued use. This belongs in the funnel because acquisition without retention is a leaking bucket.
Each stage needs a transition metric: what fraction of people move from this stage to the next, over what window.
Those fractions are what make a funnel diagnostic rather than decorative.
A worked example of finding the break
The following is hypothetical and illustrative.
A B2B product has the following monthly numbers:
- 20,000 people reach the site.
- 4,000 return or subscribe — a 20% interest rate.
- 800 request a demo — a 20% consideration rate from interested visitors.
- 120 close — a 15% conversion rate from demos.
- 100 remain active after 90 days — an 83% retention rate.
Three observations follow:
- The largest absolute loss is at the top. 16,000 of 20,000 never show interest. If the product's market is broad, this may be normal. If the site traffic is highly targeted, it signals a mismatch between the promise that brought people in and the content they find.
- Demo-to-close is the highest-value stage to improve. Each additional percentage point there yields 8 more customers a month. Because those visitors have already shown intent, a small improvement is worth more than a large lift in raw traffic.
- Retention is healthy but not the constraint. At 83%, the bucket leaks, but not enough to explain slow growth. It still deserves monitoring because a decline there would change the conclusion.
Three decisions follow:
- Improve the demo stage first — sharper qualification, better follow-up, clearer proof.
- Diagnose the top-of-funnel mismatch rather than buying more traffic.
- Keep retention as a guardrail with a defined threshold.
The funnel reveals where to work; it does not explain why. Explanations come from interviews, session review, and experiments, which is why stage metrics should be paired with qualitative evidence.
Building the measurement first
A funnel cannot be built before its measurement, because the stages are defined by what you can observe. Three prerequisites make the model usable:
Event definitions. Decide what counts as a return visit, a demo request, or a conversion, and record the rule. If the analytics tool changes its definition, the funnel's historical numbers stop being comparable. Write the definition next to the metric so a new team member can reproduce it.
A time window for each transition. "Subscribed then purchased" is meaningless without a window. Thirty days may be right for a low-consideration product and far too short for enterprise software. The window should reflect the decision cycle you actually observe, not a default in the tool.
A cohort view. Measure the transition rates for each signup month rather than one blended number. Blended rates hide changes in traffic quality — a campaign that brings more visitors who never convert will look like a funnel problem when it is an acquisition problem.
A team that builds these three things first can draw a funnel that answers questions. A team that draws the diagram first usually spends months arguing about which box a customer is in.
Where funnels break
Undefined stages.
Write the definition down.
Attribution confusion. A single conversion may touch several channels and stages. Credit rules distribute the credit; they do not measure what would have happened without each touch. Use geo experiments or holdouts when the decision is material.
Ignoring the return path. Customers move backwards and skip stages. A funnel is a simplification, and a useful one only if you remember it is a model.
The counterargument — that modern buying journeys are too nonlinear for funnels — is partly true.
The response is not to abandon the model but to keep it coarse enough to be useful and to pair it with stage-level evidence rather than pretending the diagram is literal.
A decision test
- Define each stage by an observable action with a time window.
- Measure the transition rate between adjacent stages with a denominator.
- Find the largest loss in absolute customer terms, not just the lowest percentage.
- Prioritise stages closest to intent when the impact per visitor is higher.
- Pair metrics with qualitative evidence — interviews or session review.
- Use experiments for material interventions, not attribution alone.
- Review the definitions when the product or channel mix changes.
For the demand/lead distinction, see Demand Generation vs Lead Generation; for the measurement method, see Marketing Attribution.
References & Further Reading
- Wikipedia contributors, 2026. Demand generation - Wikipedia — An overview of demand generation as a marketing discipline distinct from lead generation; secondary reference used with the lead-generation entry.
- Wikipedia contributors, 2026. Lead generation - Wikipedia — The definition of lead generation, inbound versus outbound methods, and the role of content and forms; secondary reference.
- Brian Vaver and Koehler, 2011. Measuring Ad Effectiveness Using Geo Experiments — Geo experiments for incrementality, the cleanest way to attribute marketing spend.