How to Compare Two Companies' Financials
Comparing ratios without adjusting for accounting and scale produces false conclusions. Read a normalization method and a worked example.
Two companies can report the same margin and be structurally different businesses. One owns its stores; the other rents them. One recognises revenue upfront; the other spreads it over a contract. A comparison that ignores these differences ranks the companies by their accounting choices rather than their economics.
Direct answer:
Compare companies in four steps — align the periods and definitions, normalise accounting differences, compare ratios with their drivers, and check the cash conversion behind the reported profit.
The financial-statement overview supplies the statement structure, and Investor.gov's guidance is a reminder that risk is present in all investments. The boundary: normalisation involves judgement, so document each adjustment rather than presenting the result as an exact figure.
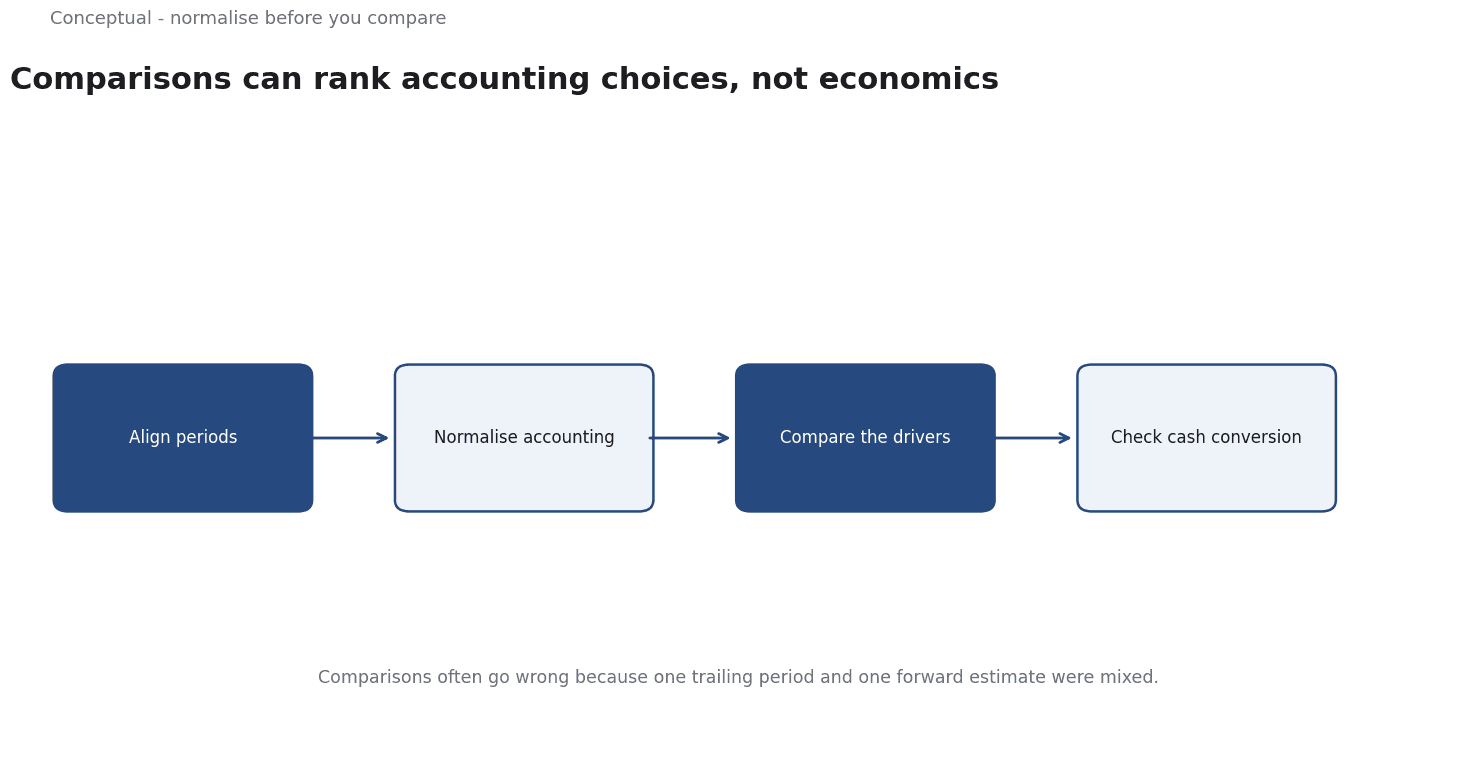
Four steps
1. Align periods and definitions. Use the same fiscal periods. Check what each company calls revenue — gross or net, before or after discounts — and whether the segments you are comparing are actually comparable.
2. Normalise accounting differences. Adjust for different depreciation policies, lease treatment, revenue recognition, and one-off items. An "adjusted" figure from one company is not automatically comparable with a reported figure from another.
3. Compare ratios with their drivers. A higher margin is meaningful only if you know why — pricing, mix, scale, or accounting. A lower return on capital may reflect a newer asset base rather than weaker performance.
4. Check cash conversion. Compare profit with operating cash flow for both companies. A persistent gap in one but not the other is a signal to investigate before trusting the ratio.
A worked example
The following numbers are hypothetical and illustrative.
Two retailers report:
| Measure | Company A (owns stores) | Company B (rents stores) |
|---|---|---|
| Revenue | 1,000m | 1,000m |
| Operating margin | 10% | 10% |
| Depreciation | 60m | 10m |
| Rent expense | 0 | 50m |
| Capital expenditure | 55m | 12m |
At first glance the margins are identical. Three adjustments change the picture:
- Capital intensity. A spends 55m a year maintaining its asset base; B spends 12m but pays 50m in rent. The economic cost of the stores is similar, and it appears in different lines. Comparing operating margin alone hides this.
- Cash conversion. If both report operating profit of 100m, A's free cash flow after maintenance capex is roughly 105m (100 + 60 − 55) and B's is roughly 140m (100 + 10 − 12), ignoring other working capital. B converts more profit to cash with less reinvestment, which makes its 10% margin more valuable.
- Balance-sheet risk. A owns assets that may be financed with debt; B has lease obligations that are now largely on the balance sheet under current standards. The risk profile differs even where the income statement looks the same.
Three conclusions follow:
- The identical margin was not an identical business.
- Cash conversion revealed the structural difference that the income statement obscured.
- The comparison needed a normalisation step — treating rent and depreciation as alternative ways of paying for the same resource.
Building a repeatable comparison
A one-off comparison depends on whoever performs it. A repeatable process makes the result auditable and lets a reader see what changed. Four habits help:
Use a fixed template. The same rows — revenue definition, margin, depreciation, leases, cash conversion, debt maturity — for every company in the set. A template prevents the comparison from silently dropping a row that is inconvenient for one company.
Show the unadjusted figures. Beside each normalised number, keep the reported one. Adjustments are judgements, and a reader should be able to see both the raw data and the interpretation.
Record the source and period. Every figure should carry the filing and the period it came from.
Write the conclusion as a hypothesis. "Company B converts more cash after normalising lease and depreciation differences, which may reflect a less capital-intensive model" is a claim that can be tested. "B is better" is not.
Where comparisons mislead
Averages hide mix. A company with a high-margin segment and a low-margin one may report the same blended margin as a company with a uniform middle margin. Compare segments if they are disclosed.
Different cycles. Two companies in the same industry can be at different points in an investment cycle. A company that has just built capacity will show high depreciation and low growth; another that invested years ago will look more efficient.
One-off items. Restructuring costs, acquisitions, and asset sales distort a single period. Read several years and identify which items recur.
The counterargument — that normalisation lets an analyst make any company look good — is fair.
The discipline is to record every adjustment and show the unadjusted figures beside them, so a reader can judge the adjustment rather than accept it.
A decision test
- Align the periods and definitions before comparing any ratio.
- List the accounting differences — depreciation, leases, revenue recognition, adjustments.
- Normalise with documented adjustments and keep the original figures visible.
- Explain each ratio gap with a driver, not just a comparison.
- Compare cash conversion alongside profit.
- Read several periods to separate structure from one-off events.
- Label the result as analysis, with the uncertainties stated.
For the statement basics, see Reading Financial Statements; for the peer-selection problem in valuation, see How to Value a Public Company.
References & Further Reading
- Wikipedia contributors, 2026. Financial statement - Wikipedia — An overview of the four financial statements and the purpose of each; a secondary reference used here with primary documents where available.
- U.S. Securities and Exchange Commission (Investor.gov), 2026. Introduction to Investing — Primary regulator guidance on market mechanics and investor protection.