How to Get Cash Conversion Cycle Right
The cash conversion cycle is a decision lever, not a single score. Read the component map, a worked example, and the limits of the metric.
The cash conversion cycle is often reported as a single number in a dashboard, detached from any decision. That habit causes teams to optimize one component and damage the whole, such as stretching supplier terms while stockouts grow. The real problem is reading the cycle as an operating system with trade-offs rather than as a score to push down.
Direct answer: The cash conversion cycle measures, in days, how long a company takes to convert resource inputs into cash inflows from sales. It combines days inventory outstanding, days sales outstanding, and days payable outstanding. Working capital is the broader pool of short-term assets and liabilities that the cycle draws from. Used well, the cycle is a management lever rather than a reporting metric.
Delta: This article adds a component-to-decision map beyond the sources. It maps each term of the cycle to a working-capital decision, with claim status explicit.
The mechanism
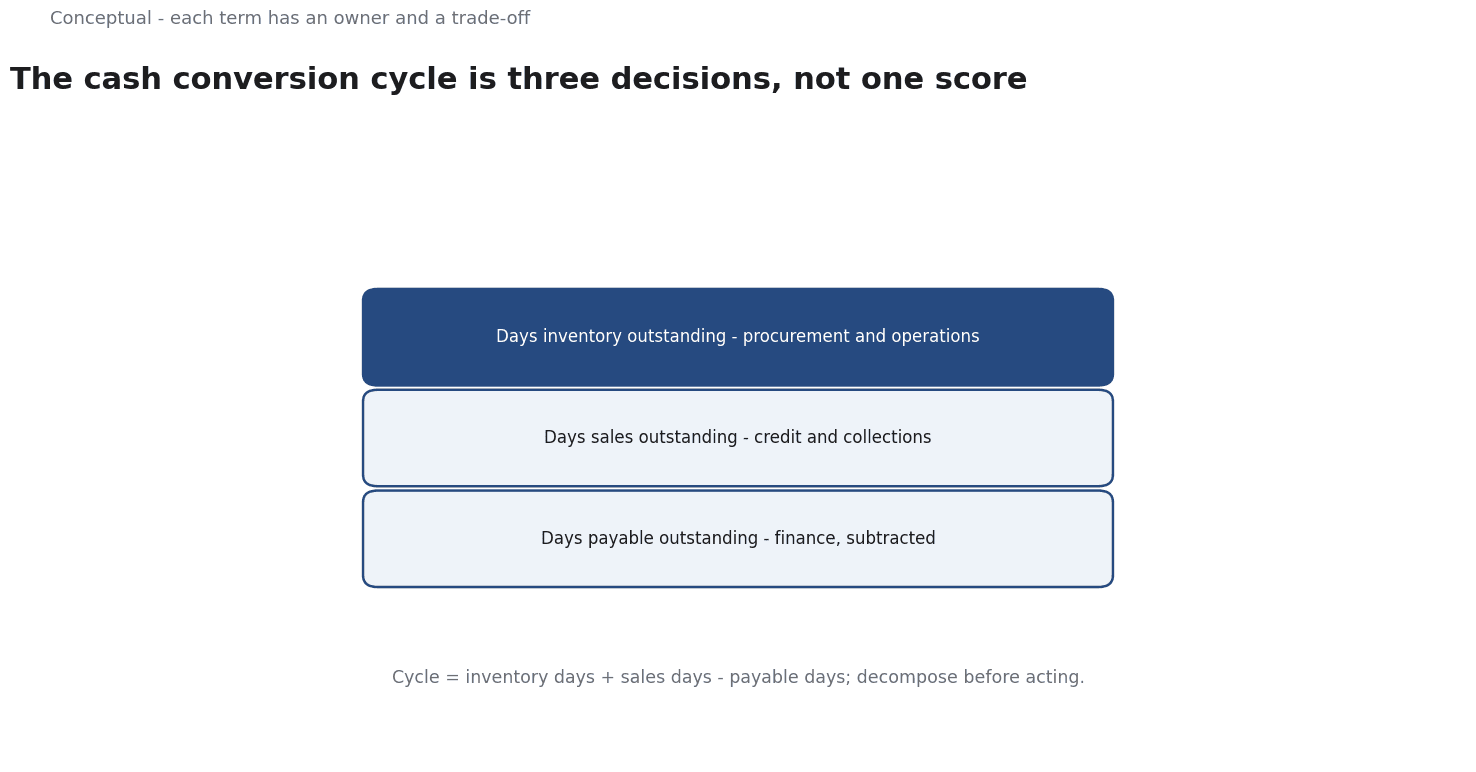
The cash conversion cycle, as described in the source, expresses in days how long it takes a firm to turn money spent on inventory and other resources into cash collected from customers. It is assembled from three components: days inventory outstanding, which tracks how long stock is held; days sales outstanding, which tracks how long receivables take to collect; and days payable outstanding, which tracks how long the firm takes to pay its own suppliers. The first two are added and the third is subtracted, because payables finance part of the operating cycle. A shorter cycle means cash returns faster; some business models even produce a negative cycle when they collect from customers before paying suppliers.
Working capital is the current assets minus current liabilities available for day-to-day operations. It includes inventory, receivables, payables, and cash itself. Managing working capital is the practice of balancing liquidity against efficiency: too much capital tied up in stock or receivables starves other uses, while too little leaves the firm unable to meet obligations. The cycle is a lens on that balance, converting the stock of working capital into a flow measured in days.
The practical consequence is that each term of the cycle corresponds to an operating decision owned by a different function. Inventory days belong to procurement and operations, sales days to credit and collections, and payable days to finance and supplier management. Because the cycle aggregates them, it shows the net effect of decisions made in separate places. That is its strength: a team can see whether improvements in one area are being cancelled by regressions in another.
That same aggregation is also the reason to decompose the number. A falling cycle can mean faster collection, which is good, or it can mean depleted inventory and lost sales, which is not. A rising cycle can mean deliberate stock building ahead of demand or a collections problem. The cycle tells a team where to look, but the diagnosis requires opening each component and reading the underlying trend.
A worked example
The following is hypothetical and illustrative. A distributor reports a cash conversion cycle of seventy-five days and sets a target to reduce it. Three checks are run before any action. First, inventory days are examined for aging stock, and they are found to be stable. Second, sales days are compared with stated credit terms, and they are found to have risen as a few large customers paid late. Third, payable days are reviewed, and the firm is found to be paying suppliers earlier than the terms allow, giving up free credit. The outcome: the cycle lengthened because collections slipped and payables were paid early, not because of inventory. The team tightens collections on the slow accounts and restores supplier terms, leaving the inventory that protects service levels intact.
Evidence status
| Claim | Status | Source | Verified | Recheck when |
|---|---|---|---|---|
| The cash conversion cycle combines inventory days and sales days minus payable days | source-reported | Cash conversion cycle (Wikipedia) | 2026-11-18 | The article is substantively revised |
| Working capital is current assets minus current liabilities used in operations | source-reported | Working capital (Wikipedia) | 2026-11-18 | The article is substantively revised |
| A shorter cycle is not always better without decomposing its components | inferred | Derived from the sources | 2026-11-18 | Component trends contradict the interpretation |
The first two rows restate definitions from the sources and change only if those definitions change. The third row is an inference about interpretation, since the sources define the metric but do not rank every movement in it. That row is the one to revisit when component data tells a different story. The table is a dated snapshot and should be reread whenever the inputs or the business model shift.
What it cannot do
The cash conversion cycle is an aggregate, and aggregates hide dynamics. A single quarter's number can be distorted by seasonality, a large one-off purchase, or the timing of a payment at period end. Two firms with the same cycle can have very different underlying positions. Reading one number as a verdict misses the components that produced it, which is why the cycle should always be shown beside its three parts and a trend line rather than on its own.
Optimizing a single term carries real costs. Cutting inventory days too far produces stockouts and lost sales. Cutting sales days too aggressively can alienate customers who value flexible terms. Extending payable days can strain suppliers, lose early-payment discounts, and damage relationships the firm relies on. Each term exists because someone made a trade-off, so pushing one down transfers cost to another part of the system rather than removing it. The cycle will not reveal that transfer on its own.
Delaying payables until after the period close or pushing sales into the current window can improve the number without improving operations. The same weakness makes cross-company comparison unreliable: business models differ, so a cycle that is healthy for a retailer may be alarming for a manufacturer. A benchmark without that context is misleading.
The cycle is also not a measure of profitability. A fast cycle attached to negative-margin sales destroys value, while a slower cycle on highly profitable, sticky contracts may be entirely rational. It says nothing about the quality of earnings, the risk of customer default, or whether the inventory held is obsolete. Those require separate analysis. Treating the cycle as a proxy for overall performance overstates what it can tell a team.
For all these reasons the metric needs scheduled review rather than a one-time target. The right level depends on supplier terms, product mix, and the customer base, all of which change. A team should review the trend across several periods, decompose any movement, and revisit the target when the operating model changes. A cycle that is not interpreted in context becomes a number that invites the wrong decision.
Counterargument: the claim that a shorter cycle is always better is fair when demand is stable and margins are healthy, and incomplete when stockouts or supplier strain are the cause, because then speed is bought at the cost of future sales.
A decision test
- Compute the cycle from inventory days, sales days, and payable days.
- Decompose the number into its three components before drawing a conclusion.
- Compare each component with stated terms and a multi-period trend.
- Identify the owner of the component that moved, such as collections or procurement.
- Cost the trade-off of any change, including stockouts or lost discounts.
- Set a target tied to the operating model, not to a generic benchmark.
- Name the recheck trigger for when terms, mix, or customers change.
The cycle is useful when it directs attention to the right operating decision, not when it is pushed down for its own sake.
The steps above keep the diagnosis attached to the components and their owners, where a change can actually be made. A target that survives a trade-off review is worth more than a number that improves for one reporting period and reverses soon after.
For further reading, see Cash Flow Forecasting.
References & Further Reading
- Wikipedia contributors, 2026. Cash conversion cycle - Wikipedia — The days-inventory, days-receivable and days-payable formula for the cash conversion cycle.
- Wikipedia contributors, 2026. Working capital - Wikipedia — Current assets minus current liabilities, and why a growing business can be cash-constrained; secondary reference.