How to Get Geo Experiments Right
A bounded guide to geo experiments that maps geographic randomization and matched markets to an incrementality decision, with setup checks and a stop rule.
Geo experiments are often treated as a simpler version of an A/B test, but they answer a different question under harder constraints. The real problem is estimating the incremental effect of advertising when individual users cannot be cleanly randomized. Without careful design, a geo test produces a number that looks precise but cannot support a budget decision.
Direct answer:
A geo experiment estimates the incremental effect of a campaign by assigning geographic areas to treatment and control and comparing their outcomes over time.
The Google research frames geo experiments as a way to measure ad effectiveness where user-level randomization is impractical, while A/B testing provides the general logic of randomized control and treatment. The practical move is to match markets before assignment, check power, and decide in advance what result would change spend.
Delta: This article adds a decision framework beyond the sources: it maps geographic test design to a budget decision, with claim status explicit.
The mechanism
The Google paper on measuring ad effectiveness with geo experiments treats geography as the unit of assignment. Instead of randomizing people, the researcher randomizes areas, then compares outcomes across treated and untreated areas over time. The practical consequence is that the design must handle the fact that a few areas carry most of the outcome: choosing and matching geos is a substantive part of the experiment, not a technical detail. A poorly matched pair can dominate the estimate.
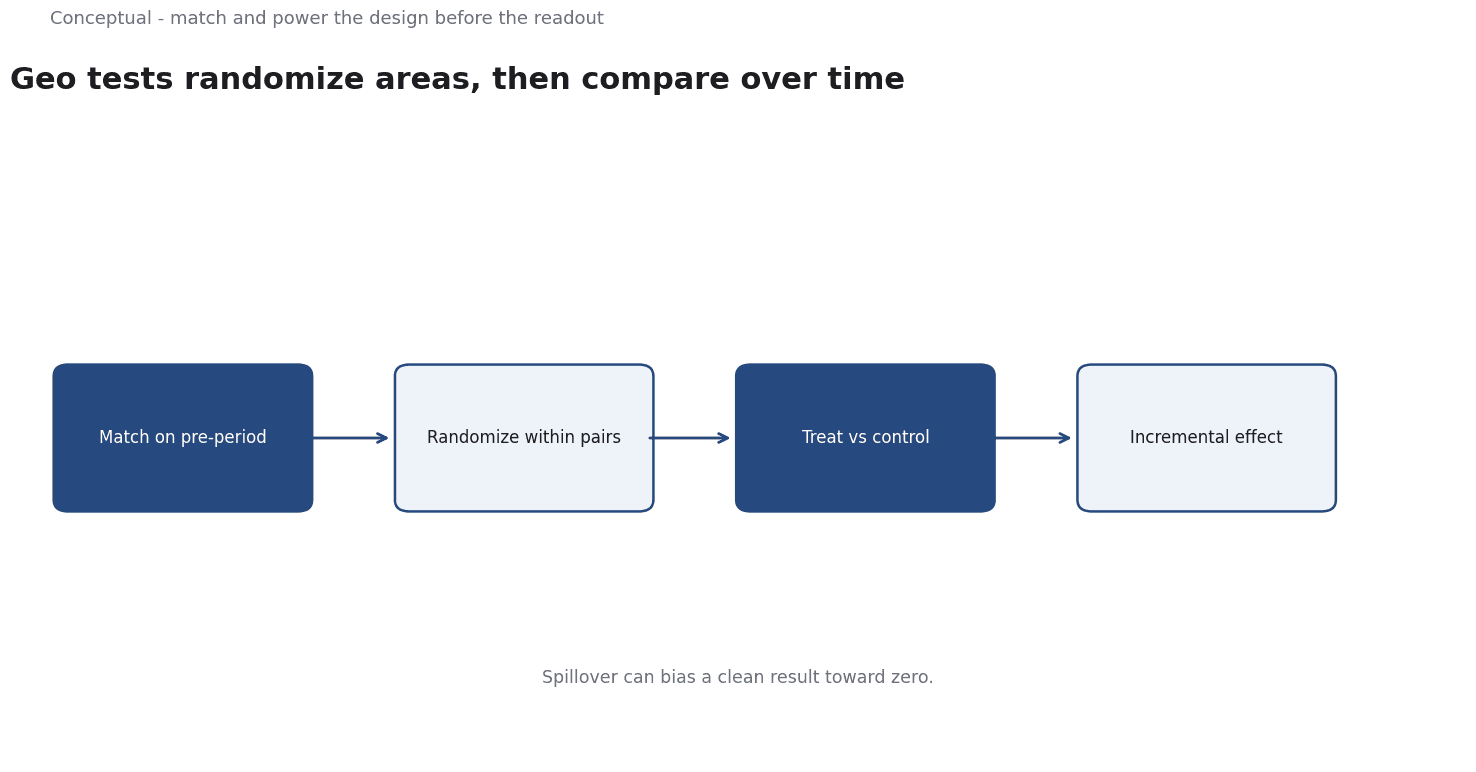
A/B testing, in the encyclopedia entry, is a randomized comparison of two variants to determine which one causes a difference in an outcome. Its logic - random assignment, a control group, and a measured difference - carries over to geo experiments, but the unit changes. The mechanism is the same: randomization is what makes the comparison causal. What changes is the noise structure, because areas differ in size, seasonality, and baseline demand. A difference that would be trivial in a user-level test can be decisive in a geo test.
Matching is the bridge between the two. Before assignment, areas are paired or grouped on pre-period outcomes and characteristics so that the treatment and control arms start similar. The practical consequence is that randomization happens within matched groups rather than across all areas. This reduces variance and makes the estimate more credible, but it also means the result depends on the quality of the matching variables. A match on the wrong dimension can hide a real difference.
Spillover is the hard boundary. People move between areas and media cross borders, so a treated campaign can affect a control area, which biases the estimate toward zero. The practical consequence is that geo experiments need buffer zones or careful selection of separated markets. The decision maker must ask whether the product and the channel make contamination plausible before trusting a clean-looking result.
A worked example
The following is hypothetical and illustrative. A hypothetical national retailer wants to know whether a regional TV campaign drives incremental sales. Three checks shape the test. First, markets are matched on pre-period sales and population so each pair starts similar. Second, a power check shows that six matched pairs, not two, are needed to detect the effect the team cares about. Third, a spillover check excludes adjacent markets where commuters cross the boundary. The outcome: the test detects a small positive effect, which clears the pre-set spend threshold, and the team scales the campaign while keeping two control markets for a confirmation period.
Evidence status
| Claim | Status | Source | Verified | Recheck when |
|---|---|---|---|---|
| Geo experiments assign geographic areas to treatment and control | source-reported | Vaver and Koehler (2011) | 2026-11-18 | Geo methods are revised |
| A/B testing relies on randomized comparison of variants | source-reported | A/B testing (Wikipedia) | 2026-11-18 | Testing standards change |
| Matching reduces variance but depends on the chosen variables | inferred | Derived from the sources | 2026-11-18 | New experiment guidance appears |
The first two rows restate design ideas from the two sources and are relatively stable, though testing practice evolves. The third row is an inference about why matched designs behave as they do. It is a planning assumption rather than a measured guarantee, and it should be revisited if guidance on geo design changes.
What it cannot do
No geo experiment can produce the user-level detail that a product team often wants, because the unit of analysis is the area. Aggregated outcomes hide who responded and why, and a positive estimate does not identify a mechanism. The practical consequence is that a geo test answers whether a campaign moved the aggregate outcome, not which creative or audience drove it. Treating it as a substitute for user-level analysis overstates what the design can deliver.
The hidden cost is duration and coordination. A useful geo test often runs for weeks, holds out real markets, and requires clean outcome data by area. During the holdout, the firm forgoes the campaign's expected benefit in control regions, and that opportunity cost belongs in the decision. The practical consequence is that a geo test is worth running only when the decision at stake is large enough to justify both the delay and the withheld spend.
With few areas, estimates swing widely, and repeated peeking at results turns a noisy number into a false signal. Post-hoc selection of markets after seeing outcomes destroys the randomization that made the comparison credible. The practical consequence is that design choices must be locked before the first result is viewed, and the stop rule must be written in advance.
Spillover sets a hard boundary. People commute, media cross borders, and national campaigns rarely respect analysis regions. When a treated area influences a control area, the measured difference shrinks, and a true effect can be declared null. The practical consequence is that market selection and buffer zones are not optional refinements. If the channel cannot be contained, a geo experiment is the wrong instrument.
Finally, effects decay and conditions change. A campaign that worked in one season may not work in another, and a single estimate should not be reused indefinitely. The decision test should schedule a confirmation window and a recheck when the creative, channel, or competitive context shifts. A clean result is a snapshot, not a permanent property of the campaign.
Counterargument: the counterargument that a simple pre-post comparison is good enough is fair for tiny, low-stakes campaigns and incomplete when the spend decision is large, where confounding dominates the result.
A decision test
- Define the incremental decision the test must support.
- Check whether user-level randomization is feasible; if so, prefer A/B testing.
- Choose an outcome that can be measured by area.
- Match areas on pre-period behavior and characteristics.
- Check power and set the test length before launch.
- Screen for spillover and buffer contaminated markets.
- Set a spend threshold and a stop rule before reading results.
These steps put design before readout: the decision defines the outcome, the outcome defines the match, and the match defines the power check. The stop rule is what keeps a noisy result from being read as a win. Revisit the test when the channel, creative, or market structure changes, because a design that worked once is not automatically reusable.
For further reading, see Marketing dashboards without the hype.
References & Further Reading
- Brian Vaver and Koehler, 2011. Measuring Ad Effectiveness Using Geo Experiments — Geo experiments for incrementality, the cleanest way to attribute marketing spend.
- Wikipedia contributors, 2026. A/B testing - Wikipedia — Controlled comparison of two variants.