How to Get Profitability Ratios Right
Profitability ratios compare profit to a base. Read the definitions, a worked example, and why margins need consistent inputs and a clear denominator.
Profitability ratios are often quoted as if the number alone settles a question, but a ratio is only as sound as the two figures it divides. The Wikipedia profit margin entry describes margins as profit relative to revenue, and the financial statement entry describes the reports that supply the inputs. The real problem is that ratio comparisons routinely break because the inputs were not defined consistently in the first place.
Direct answer: A profitability ratio divides a profit measure by a base such as revenue or assets, each drawn from a defined line of a financial statement. The sources define the measures and the statements; the rule that numerator and denominator must be consistent is a synthesis. Without that consistency, a higher ratio can reflect a definition change rather than better performance.
Delta: This article adds a claim-status table and an input-consistency test beyond the sources: it maps each ratio to the statement lines behind it, with claim status explicit.
The mechanism
The profit margin entry describes profit expressed relative to revenue, with variants such as gross, operating, and net margin depending on which profit figure is used. Each variant answers a different question. Gross margin speaks to production cost, operating margin to the cost of running the business, and net margin to what remains after financing and tax. The practical consequence is that the word margin is not specific enough. A comparison is meaningful only after the exact profit line is named.
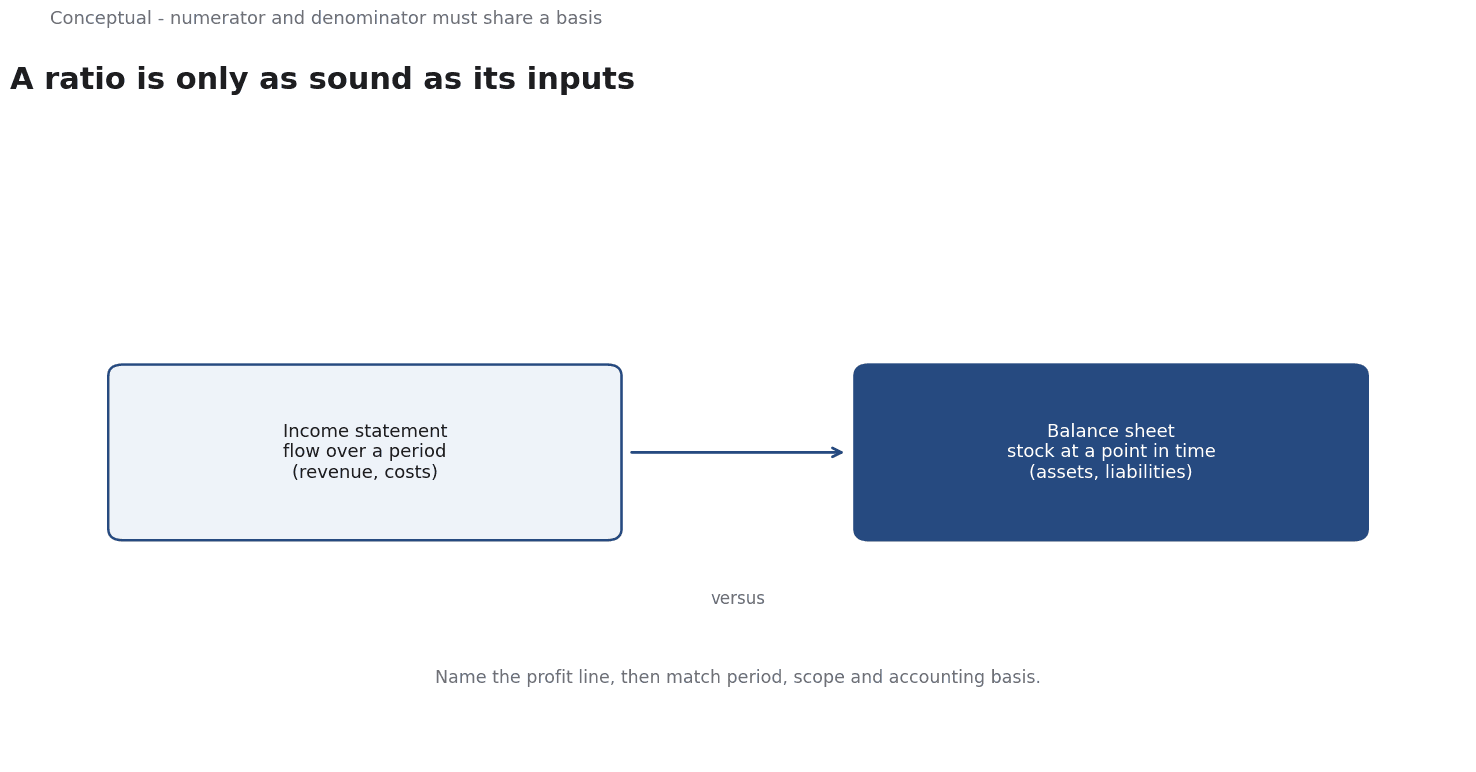
The financial statement entry describes the reports that provide these lines: the income statement, which records revenue and costs over a period, and the balance sheet, which records assets and liabilities at a point in time. This distinction matters for the denominator. Revenue is a flow measured over a period, while assets are a stock measured at an instant. Mixing a period flow with an end-of-period stock without care is a common source of distortion.
Consistency is the practical discipline.
The profit figure and the base must come from the same period, the same scope, and the same accounting basis.
A ratio built from a full-year income statement and a year-end balance sheet is common, but it should be labelled so that a reader knows which conventions were used. The sources define the statements and margins; they do not prescribe a comparison convention, so the choice is a local one that must be stated.
The sources do not say which ratio a given business should watch. Selection is inferred, not source-reported. A useful method is to start with the decision - pricing, cost control, or capital efficiency - and choose the ratio that isolates the relevant line. That keeps the ratio tied to a question and reduces the temptation to shop for the most flattering figure.
A worked example
The following is hypothetical and illustrative. An analyst compares two firms using net margin and return on assets. Three checks decide whether the comparison holds. First, do both firms use the same profit line and the same period for revenue? Second, is the asset figure a point-in-time balance, and was it averaged or taken at year end? Third, are there one-off items or different accounting bases that would shift the numerator without changing operations? The analyst finds that one firm's margin includes a one-time gain and that asset figures use different conventions, so the raw comparison is set aside and the ratios are restated on a common basis. The numbers are hypothetical; the verification method is the contribution.
Evidence status
| Claim | Status | Source | Verified | Recheck when |
|---|---|---|---|---|
| Profit margin expresses profit relative to revenue | source-reported | Wikipedia, Profit margin | 2026-11-18 | Definition revised |
| Financial statements supply the income and balance sheet lines | source-reported | Wikipedia, Financial statement | 2026-11-18 | Reporting standards change |
| Keep numerator and denominator on the same basis before comparing | inferred | Derived from the sources | 2026-11-18 | Accounting policy changes |
The first two rows restate definitions in the sources. The third row is a synthesis, since neither source sets a comparison rule. Recheck the definitions if the source entries change, and recheck the inferred claim when accounting policy, period, or reporting scope changes.
What it cannot do
A profitability ratio cannot, by itself, explain performance. It summarises a relationship between two lines and leaves out what produced them. A high margin can come from pricing power, a favourable mix, or a cost that was simply deferred. The profit margin entry describes the measure, not the causes behind it. A ratio should therefore be a starting question rather than a conclusion.
The hidden cost is sensitivity to accounting choices. Depreciation methods, inventory valuation, and the timing of recognition all move the reported lines that feed a ratio. Two companies can report different margins from similar economics because they made different legitimate choices. The sources describe the statements but do not reconcile such policies, so the differences must be identified by reading the notes to the accounts rather than the headline figures.
A margin drawn from one period against a balance sheet from another, or a profit line that includes a one-off item, produces a number that looks precise and is not. This risk is inferred from the structure of the sources, which define the inputs but do not enforce consistency. The burden of checking the basis falls on the person building the ratio.
There is a boundary around what a ratio covers. It reflects the scope of the statements it draws from, so a group-level ratio can hide weak units and a consolidated figure can obscure the business that matters. Ratios also look backward; they describe a period that has ended, not the next one. The financial statement entry describes reporting, not forecasting, so a ratio should not be treated as a prediction.
Because policies and scope change, ratios need periodic review. The exact lines, period, and accounting basis should be recorded alongside each figure, and a comparison should be restated when those inputs move. A trend is only meaningful if the definition held steady across it. Without that record, a change in the ratio can be mistaken for a change in the business.
The counterargument that a single ratio is fair for a quick screen is incomplete when it is used to rank firms, because differing accounting bases can reverse an apparent lead without any change in operations.
A decision test
- Name the decision the ratio is meant to inform.
- Choose the profit line that fits that decision.
- Identify the base and its statement source.
- Confirm period, scope, and accounting basis match.
- Check for one-off items and policy differences.
- Restate comparisons on a common basis.
- Record the definition and set a recheck date.
A ratio is a claim about a relationship, and its strength depends on the inputs behind it. The test makes those inputs visible so a reviewer can see what was measured, on what basis, and when it should be rechecked. For further reading, see Decision Memos That Survive Review.
References & Further Reading
- Wikipedia contributors, 2026. Profit margin - Wikipedia — Profit expressed as a share of revenue.
- Wikipedia contributors, 2026. Financial statement - Wikipedia — An overview of the four financial statements and the purpose of each; a secondary reference used here with primary documents where available.