How to Get Scenario Analysis Right
Scenario analysis tests a decision across coherent futures, not a single forecast. Read how NGFS pathways and discounted cash flow connect, with limits and a decision test.
Scenario analysis is often run as a spreadsheet ritual: a few inputs are changed, a range of outputs is produced, and the middle case is presented as the plan. That conflates a set of plausible futures with a point estimate. NGFS publishes structured climate pathways for financial risk work, and discounted cash flow shows how assumptions compound into a single value. The question is which decision the analysis actually changes.
Direct answer: Use scenario analysis to test whether a decision holds across a small set of internally consistent states of the world, not to predict one future. NGFS scenarios provide climate transition and physical-risk pathways, while discounted cash flow shows how growth, margin, and discount-rate assumptions combine into value.
The boundary is that a scenario is a coherent story with numbers attached, not a probability-weighted forecast.
Delta: This article adds a claim-status table and a decision test beyond the sources: it maps each scenario to the single assumption it stresses, with claim status explicit.
The mechanism
NGFS scenarios are defined as pathways built from joint assumptions about policy, technology, and the physical climate. The important property is internal consistency: variables move together because the story requires them to. A transition pathway that assumes rapid decarbonization also assumes something about energy prices, capital costs, and demand. Pulling one of those variables out of the pathway and changing it alone breaks the logic that made the scenario useful. The practical consequence is that scenarios should be selected as packages, not assembled from isolated sensitivities.
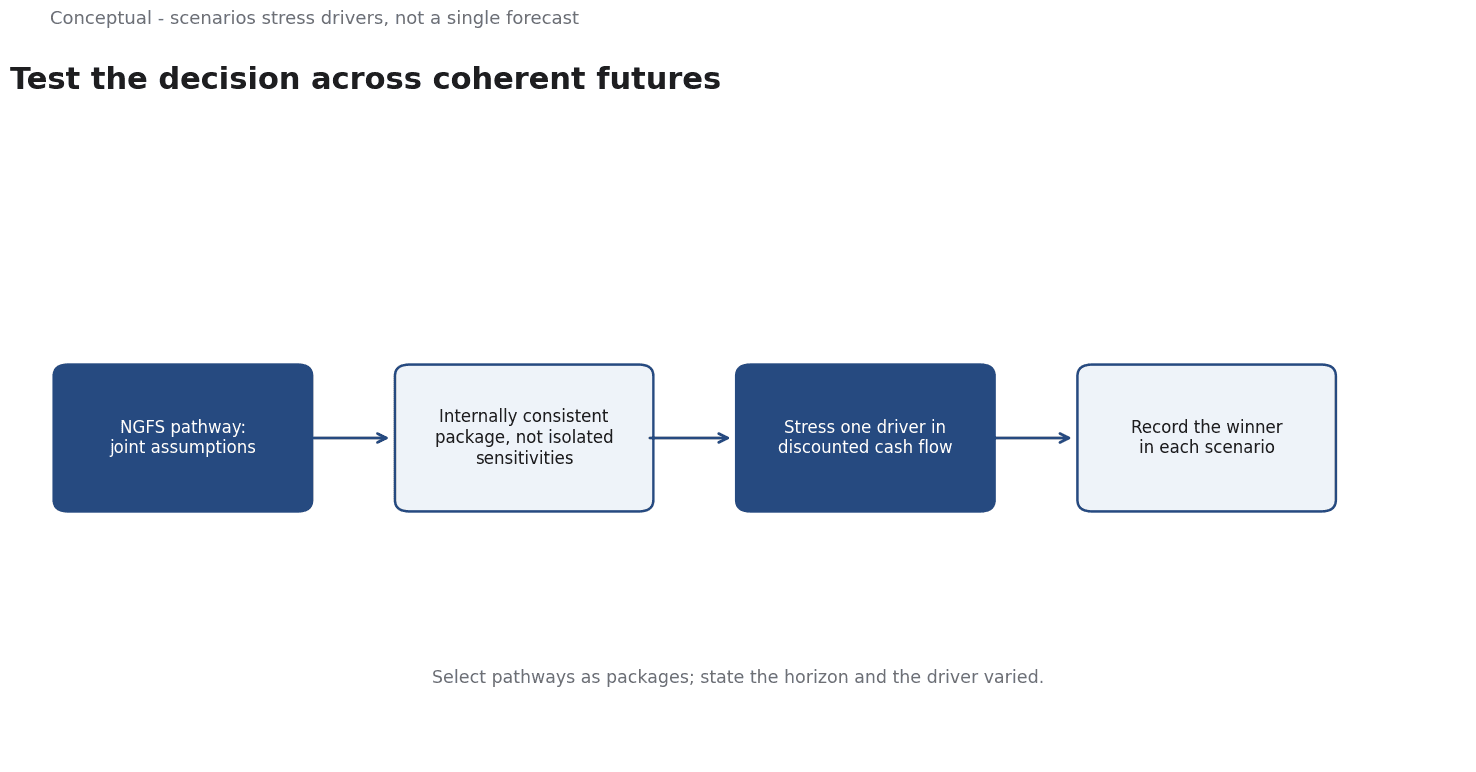
Discounted cash flow is the mechanism by which those assumptions become a number. Expected future cash flows are discounted to the present at a rate that reflects both time and risk. The practical consequence is that small changes in the discount rate or the terminal growth assumption can dominate the result, particularly for cash flows that sit far in the future. This is why scenario analysis belongs on the drivers rather than on the output. A statement that value falls by a fifth under a given scenario is a conclusion; the analysis is the chain of assumptions that produced it.
The design principle that follows is to match the scenario to the decision. Long-horizon climate pathways speak to exposure that accumulates over decades, such as the residual value of a long-lived asset or the credit quality of a book with slow turnover. They are a poor instrument for a short-cycle operating choice whose feedback arrives in months. A discounted cash flow sensitivity table, in contrast, is well suited to choosing between investments with different timing of returns. In both cases the discipline is the same: state the horizon of the decision and name the driver being varied, so that the scenario does not quietly become a general statement about the future.
The final step is to separate what the sources establish from what the analyst decides. The existence and structure of published climate scenarios, and the mechanics of discounting, are documented. Which driver to stress for a particular decision is a local judgment. Keeping that distinction visible prevents a model output from being read as a fact the sources asserted.
A worked example
The following is hypothetical and illustrative. A finance team is deciding whether to commit to a long-lived asset with a payback measured in decades. Two climate pathways and a discount-rate sensitivity are on the table. Three checks decide the value of the exercise. First, is each pathway internally consistent, with policy, energy price, and demand assumptions moving together, rather than a single variable changed in isolation? Second, which driver does each scenario stress in the cash-flow model, and is that driver stated explicitly rather than implied by a label? Third, does the preferred option actually change under any scenario, or does the same asset win in every case? The outcome is a short record naming the decision, the driver stressed, and the winner in each scenario. If the same option wins throughout, the analysis did not change the decision, and that should be stated rather than buried under a range of values.
Evidence status
| Claim | Status | Source | Verified | Recheck when |
|---|---|---|---|---|
| Climate pathways are published for financial risk analysis | source-reported | NGFS | 2026-11-18 | Scenario set revised |
| Discounted cash flow converts future cash flows to present value | source-reported | Wikipedia DCF | 2026-11-18 | Definition revised |
| Mapping each scenario to one decision driver is inferred | inferred | Derived from the sources | 2026-11-18 | Decision context changes |
Two rows describe documented material: the existence of structured pathways and the mechanics of discounting. The third row is a synthesis, because which driver deserves stress is a choice the sources do not make for the reader. Recheck the first row when the scenario set is revised and the second when the reference definition changes.
What it cannot do
Scenario analysis cannot assign probabilities. A pathway describes a coherent state of the world, not the likelihood of reaching it. Once a team attaches percentages to each path and multiplies them together, it has produced a pseudo-forecast with more precision than the underlying assumptions support. The number looks rigorous because it is the product of arithmetic, but the probabilities were inputs, not findings. This is the most common way a scenario exercise quietly turns back into the point estimate it was meant to replace.
The hidden cost is coordination. Building an internally consistent set of assumptions requires input from people who understand policy, technology, and demand, not just the model owner. That is slower and more expensive than running a one-variable sensitivity table, and it is easy to skip under deadline pressure. The spreadsheet is the cheap part; the agreement about what each pathway means is the expensive part. A team that cannot afford the agreement should be honest that it is running sensitivities, not scenarios.
Selecting the favorable pathway and presenting it as the analysis gives a predetermined choice the appearance of rigor. A related failure is averaging the scenarios into a central case, which discards exactly the information the exercise was meant to surface, namely that the options rank differently under different states of the world. Both failures are hard to detect from the output alone, which is why the decision test below records the winner in each case before any summary is written.
There is also a boundary of horizon. Climate pathways typically operate over decades, while many capital and operating decisions have much shorter feedback loops. Using a mid-century scenario to approve a current-year budget is a category error: the scenario says something about a risk that will accumulate slowly, not about next year's cash. Equally, a discounted cash flow model whose terminal value dominates the result is fragile to the terminal assumptions regardless of which scenario is applied, because most of the value sits beyond the explicit forecast period.
Finally, scenarios age. Policy shifts, technology costs move, and a pathway that was plausible at publication can lose relevance well before its stated horizon. A scenario set therefore needs scheduled review, and the review should ask not only whether the assumptions still hold but whether the decision the analysis was built to inform is still the decision on the table. Without that second question, teams maintain a library of pathways that no longer connect to any live choice.
Counterargument: "The counterargument that a simple sensitivity table is enough is fair for short-horizon decisions with one dominant driver, and incomplete when several assumptions must move together to describe a coherent state of the world."
A decision test
- State the decision and the date by which it must be made.
- Choose two to four scenarios that differ on a clearly named driver.
- Check that each scenario is internally consistent across its assumptions.
- Map each scenario to the single assumption it stresses in the model.
- Record which option wins under each scenario before writing any summary.
- If the same option wins everywhere, state that the analysis did not change the decision.
- Set a review date for both the scenario set and the decision rule.
The test is designed to keep the analysis tied to a choice. If a team cannot say which decision changes under which scenario, it has produced a range of numbers rather than an analysis. Recording the winner in each case makes the result auditable and stops a later reader from treating the favorable path as a forecast. For further reading, see Decision memos that survive review.
References & Further Reading
- NGFS, 2026. Network for Greening the Financial System — The standard climate scenarios used for financial risk analysis.
- Wikipedia contributors, 2026. Discounted cash flow - Wikipedia — The structure and use of discounted cash flow analysis.