How to Measure AI Adoption in Your Organization
Licence counts are not adoption. Read the four signals to measure, a worked survey example, and why use does not equal productivity.
An organisation can have thousands of AI licences and no change in how work gets done. Counting seats is easy and nearly meaningless. The NBER working paper on generative AI adoption is useful precisely because it separates measures — any use, use at work, weekly use, daily use — instead of reporting one number.
Direct answer: Measure adoption with four signals: access, reported use, frequency of use in specific workflows, and outcomes. Bick, Blandin and Deming's surveys found that "as of late 2024, nearly 40 percent of the U.S. population age 18-64 uses generative AI", with 23% of employed respondents having used it at work in the previous week and 9% every workday. The boundary: these are survey reports of use, not measurements of productivity — METR's randomized trial found early tools slowed experienced developers before later data reversed that result.
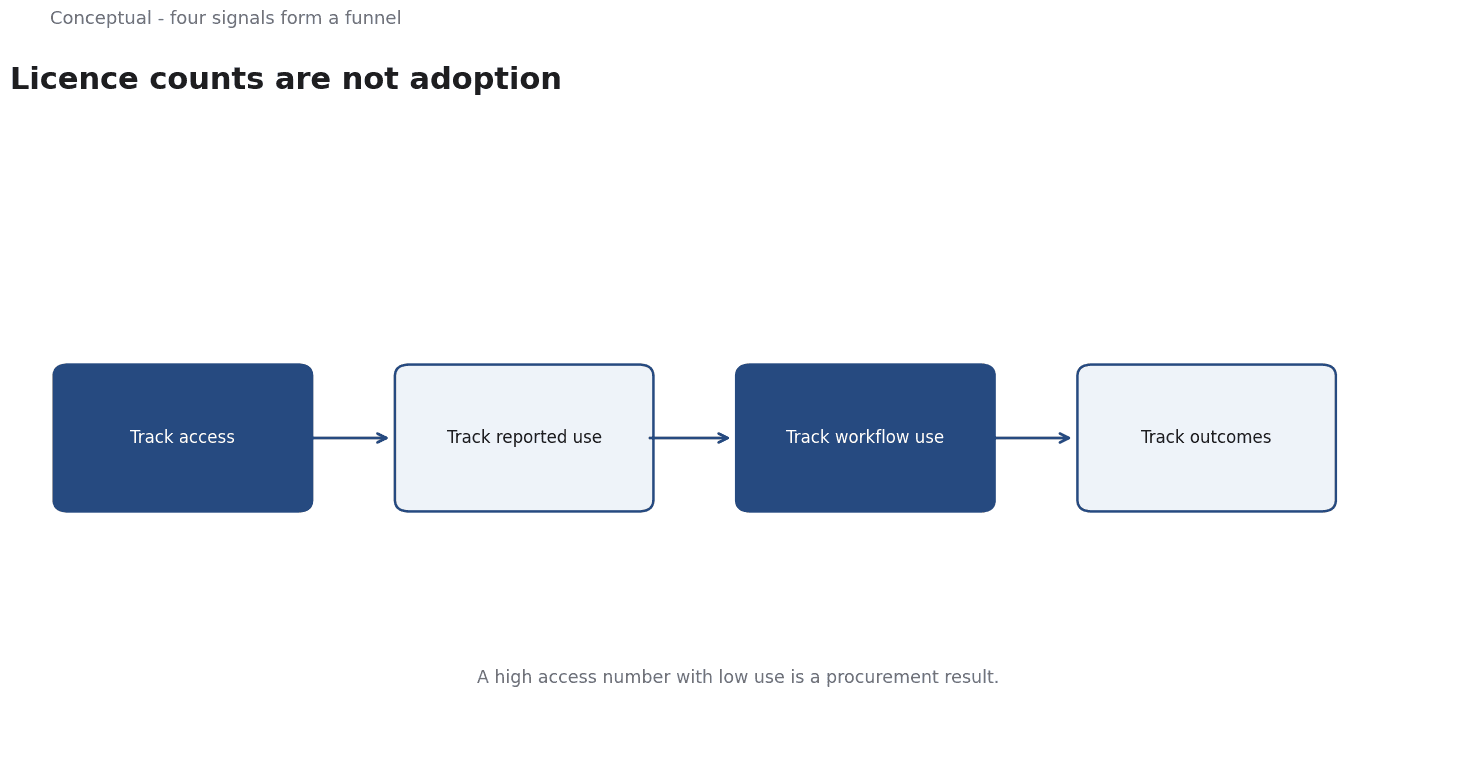
Four signals
1. Access. Who has a licence and can use a tool. This is a ceiling, not adoption.
2. Reported use. Ask whether someone used a tool in a defined window, with the same wording as a benchmark you trust. "Have you used generative AI for work in the last seven days?" is a measurable question; "do you use AI?" is not.
3. Workflow frequency. Which tasks is it used for, and how often? A person who uses a tool once a week to draft emails has a different relationship to it from one who uses it daily for code review. The task taxonomy article distinguishes the underlying types.
4. Outcomes. Time per task, error rate, quality, or cycle time — measured against a baseline. This is the only signal that tells you whether adoption created value.
The signals are a funnel: access enables reported use, reported use may become workflow integration, and integration may produce outcomes.
Each stage can fail independently.
A worked example of a survey
The following is hypothetical and illustrative.
A company of 2,000 staff wants to measure AI adoption. It sends a survey to all staff and receives 1,200 responses.
- Access: 1,000 of 2,000 staff have a licence — 50%.
- Reported use: 600 of 1,200 respondents say they used a tool at work in the last seven days — 50%.
- Workflow frequency: 180 of those 600 say they used it daily; 420 used it once or twice in the week.
- Outcomes: a follow-up with 50 daily users finds a measured time saving on one task, but no change in cycle time at the team level.
Three cautions follow:
- Response bias. With a 60% response rate, the respondents may be the enthusiasts. The 50% use figure is an upper bound if non-respondents are less engaged.
- Denominators must be stated. "50% of respondents" and "30% of all staff" are different claims. The NBER paper is careful to specify its population — employed respondents, working-age population — and a company survey should do the same.
- Use is not outcome. Daily use with no cycle-time change is a real finding. It may mean the tool helps individuals while the workflow's bottleneck sits elsewhere, which is a process problem rather than an adoption problem.
Three decisions follow:
- Report all four signals separately, not as a single adoption score.
- State the denominator and response rate alongside every figure.
- Pair the survey with one process measurement — a task's time or error rate — to test whether use changed anything.
What adoption figures do not show
They do not show value. The NBER paper describes fast diffusion, not proven economic impact. The METR result is the clearest reminder that using a tool can be slower.
They do not show depth. A daily user may use the tool for one trivial task. Without the workflow question, the frequency number flatters the programme.
They do not show distribution. Adoption can be concentrated in one function while others are untouched. Aggregate figures hide that, and the teams left behind may be the ones with the most to gain.
The counterargument — that measuring adoption is itself overhead — is fair.
The response is to keep the survey short: four questions, one process metric, and a repeat every quarter. That is enough to detect direction without building a measurement programme.
A decision test
- Separate access, use, frequency and outcomes.
- Use the same question wording each wave so results are comparable.
- State the population and response rate with every figure.
- Ask which task the tool is used for, not just whether it is used.
- Pair the survey with one process metric from a baseline.
- Break results down by function to find the gaps.
- Treat use without outcome as a question, not a success.
For the broader evidence, see The Rapid Adoption of Generative AI and the field study of AI at work; for the implementation sequence, see AI Integration Into an Existing Business.
References & Further Reading
- Erik Brynjolfsson, Danielle Li, and Lindsey R. Raymond, 2024. The Rapid Adoption of Generative AI — Workforce-level adoption data and the productivity-gap evidence.
- Joel Becker, Nate Rush, Beth Barnes, David Rein (METR), 2025. Measuring the Impact of Early-2025 AI on Experienced Open-Source Developer Productivity — Randomized trial finding early-2025 AI tools made experienced developers 19% slower, with a 2026 update; used as a caution against assuming adoption equals productivity.