How to Think Like an Engineer When Solving Business Problems
Engineering thinking is decomposition, explicit assumptions, and measurement. Read the method, a worked business example, and the point where it becomes over-engineering.
"Think like an engineer" is often used to mean being logical. That is too vague to be useful. The distinctive thing engineers do is make assumptions explicit, decompose a system into parts with defined interfaces, and measure whether the result behaves as predicted. Applied to a business problem, the same habits turn a vague complaint into a testable claim.
Direct answer: The method is to define the system boundary, decompose the problem, state assumptions with their uncertainty, build the smallest model that can be wrong, and measure the outcome against a baseline. Kuhn and Johnson's Feature Engineering and Selection is a good methodological reference because it insists that a variable's value depends on the prediction context, while scikit-learn's validation guidance supplies the discipline for testing. The boundary: the method produces clarity, not certainty, and a model is a tool for reasoning rather than a substitute for judgement.
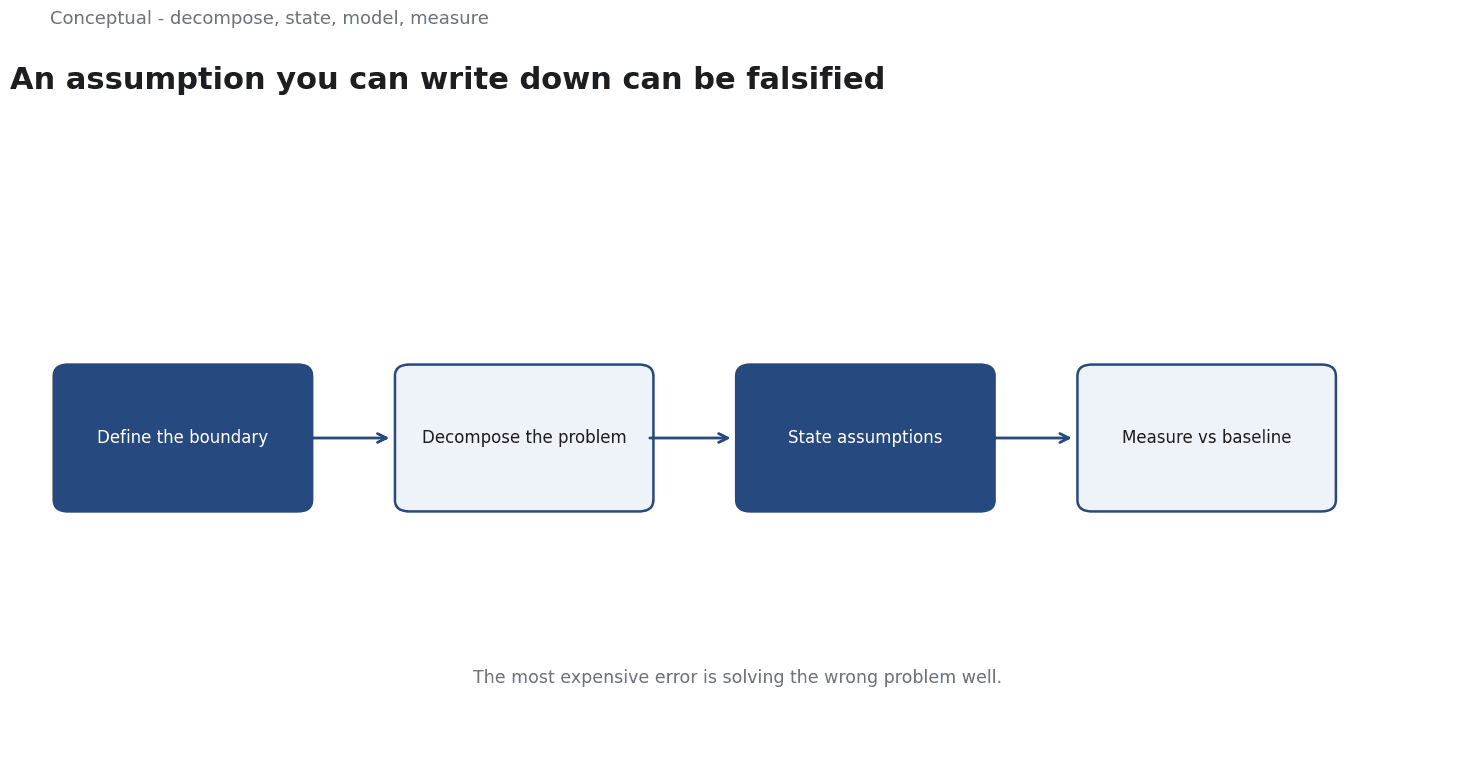
The five moves
1. Draw the boundary. What is inside the system you are analysing, and what is an external input? A complaint like "conversion is down" has no boundary. "Conversion from pricing page to trial signup for new organic visitors since March" does.
2. Decompose. Split the system into stages with measurable flows. If each stage has an input count, an output count, and a conversion rate, the stage causing a change becomes visible.
3. State assumptions. Write down what you believe about each stage and how confident you are.
This is the step that separates engineering reasoning from storytelling, because a written assumption can be falsified.
4. Build the smallest useful model. A spreadsheet with explicit inputs beats a complex model whose workings nobody can inspect. The purpose is to see which assumption matters most, not to impress.
5. Measure against a baseline. Without a counterfactual, you cannot tell whether an intervention worked. scikit-learn's warning about leakage applies in spirit: using information that would not have been available at the decision time produces a flattering but useless evaluation.
A worked example of a funnel problem
The following scenario and numbers are hypothetical and illustrative.
A subscription business reports that revenue growth slowed from 20% to 5% year over year. The instinctive response is "improve the product". An engineering-style decomposition asks where the slowdown is.
| Stage | Last year | This year |
|---|---|---|
| Visitors | 100,000 | 150,000 |
| Trial starts | 10,000 (10%) | 12,000 (8%) |
| Paid conversions | 2,000 (20%) | 1,800 (15%) |
| Average revenue per user | 50 | 55 |
Revenue moved from 2,000 × 50 = 100,000 to 1,800 × 55 = 99,000 — roughly flat per period, despite 50% more visitors.
Two stages deteriorated: trial-start rate from 10% to 8%, and trial-to-paid from 20% to 15%. Which matters more? A sensitivity calculation answers it:
- Restoring trial starts to 10% alone: 15,000 trials × 15% = 2,250 paid × 55 = 123,750.
- Restoring trial-to-paid to 20% alone: 12,000 × 20% = 2,400 paid × 55 = 132,000.
The second lever is larger, even though the first deterioration looks bigger in percentage points. The engineer's question — "what is the sensitivity of the outcome to each assumption?" — overturns the intuitive priority.
Three caveats keep this honest:
- The decomposition is only as good as the stage definitions. If "visitor" changed meaning when the marketing team switched attribution, the comparison is invalid.
- The numbers are averages. A drop in trial-to-paid might be concentrated in one acquisition channel; the aggregate hides it.
- The model does not explain why. It tells you where to investigate, not what to fix. For that you need customer evidence, which is a different method.
Define the problem before decomposing it
A team that decomposes "conversion is down" into a funnel is already committed to a view of the cause; the key question may be whether the traffic changed quality.
A useful discipline is to write three versions of the problem before choosing one:
- The reported problem: "conversion is down."
- The measurable problem: "paid conversion from organic pricing-page visitors fell from 20% to 15% between March and June."
- The decision the answer will support: "whether to invest in onboarding or in acquisition quality."
These are different claims. The first invites a broad search, the second defines what to measure, and the third sets a budget for the investigation. A team that jumps from the first to a solution has skipped the two steps that make the work useful.
Kuhn and Johnson's context principle applies here too: the same metric can mean different things under different populations and time windows. A 15% conversion rate is a crisis if the visitors are qualified buyers and unremarkable if a campaign changed the traffic mix. The decomposition cannot tell you which, because the explanation lies outside the funnel — in the data definition and the channel history.
When the method becomes over-engineering
Three failure modes are worth naming.
Modelling what you cannot measure. A beautifully specified model fed by unreliable inputs produces precise-looking nonsense. The first engineering question is always about data quality, not model sophistication.
False precision. A calculation that yields 123,750 implies a level of knowledge the inputs do not support. Presenting ranges and sensitivities is more honest than a single number.
Treating the map as the territory. The funnel table is a representation of a business, not the business. A team can spend weeks refining the model while the actual cause — a pricing page change, a competitor, a support issue — sits outside its boundary.
This is the point where the engineering mindset meets its counterargument. Business decisions often arrive with incomplete data, political constraints, and time pressure, and an insistence on perfect measurement can be a way of avoiding a decision.
The disciplined version of the method says: state the assumption, make the smallest test, and decide with the evidence you can get.
Damodaran's valuation work is a useful counterweight here. It is explicitly a framework for making decisions under uncertainty, where the output is a range and the value lies in the assumptions being visible — not in a number that pretends to be certain.
A decision test
- State the problem with a boundary — population, time window, and metric.
- Decompose into stages with input, output, and conversion at each.
- Compare against a baseline and check that definitions did not change.
- Rank assumptions by sensitivity before choosing where to investigate.
- Build the smallest model that can be wrong, with explicit inputs.
- Collect evidence outside the model before committing to a cause.
- Decide with a stated uncertainty and a review date.
For the feature-context principle, see Feature Engineering; for the business framing, see Business Model Canvas.
References & Further Reading
- Max Kuhn and Kjell Johnson, 2019. Feature Engineering and Selection: A Practical Approach for Predictive Models — The closest thing to a reference text on feature construction, resampling, and selection.
- scikit-learn developers, 2026. Cross-validation: evaluating estimator performance (scikit-learn) — Time-series splits and the validation design that keeps a backtest honest.
- Aswath Damodaran, 2026. Damodaran Online: Home Page for Aswath Damodaran — Publicly maintained datasets for industry averages, WACC, and valuation.