Business Model Canvas: Mapping How a Company Creates Value
A canvas is a shared hypothesis about how the business works. Read how to use it to find dependencies and test the riskiest assumption.
The Business Model Canvas is often used as a one-page exercise in a workshop, and that is its least valuable use. Filling in nine boxes produces a picture of what the team already believes. The value appears when the picture is used to ask which beliefs are load-bearing, which are supported by evidence, and which would kill the business if they were false.
Direct answer: A canvas maps how an organisation creates, delivers, and captures value: customer segments, value propositions, channels, relationships, revenue streams, key resources, key activities, key partners, and cost structure. The critical step is to identify the two or three assumptions the model cannot survive without, and to test those before investing in the rest. Porter's warning that "operational effectiveness is not strategy" is relevant: a canvas full of good intentions about being better does not describe a position with trade-offs.
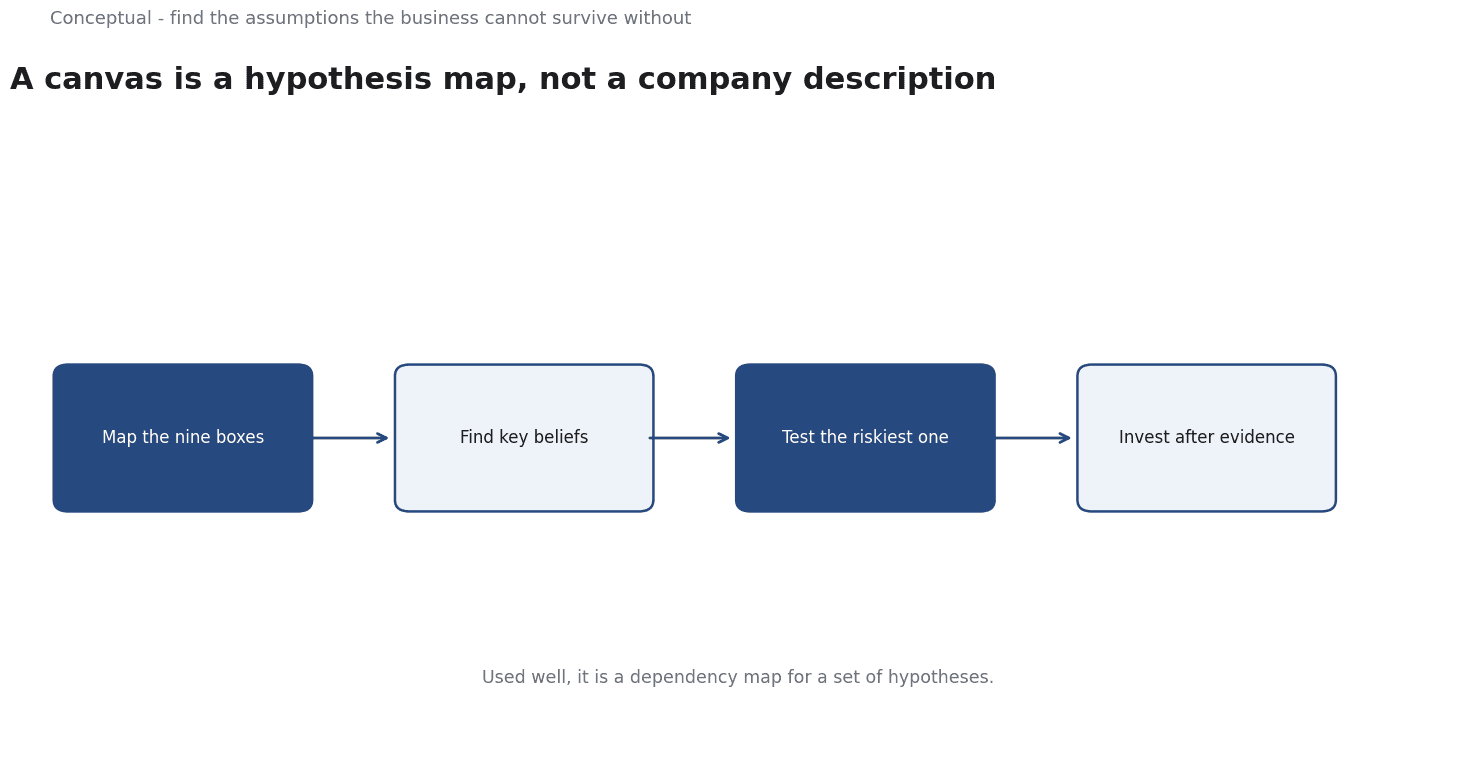
Used well, it is a dependency map for a set of hypotheses, not a description of a company.
What the boxes are actually for
The canvas divides a business into nine areas, and the division matters because it forces questions that a product roadmap does not.
Customer segments asks who the business serves, and — more usefully — who it deliberately does not serve. A canvas that lists "everyone who needs X" has not done the work.
Value propositions asks what changes for those customers. The answer should be a specific improvement in their situation, not a list of product features.
Channels asks how the value proposition reaches them. This is where the distribution question becomes visible, and where many otherwise sound models fail.
Customer relationships asks what kind of relationship the model requires — self-serve, dedicated support, community, or a long-term account. Each has a cost that must appear in the cost structure.
Revenue streams asks how the business captures value. The distinction between a one-time sale, a subscription, usage-based charging, and a marketplace take rate is not cosmetic: each implies different customer behaviour and different cash timing.
Key resources, activities, and partners ask what the model depends on. This is where the canvas becomes a dependency map.
Cost structure asks what must be paid, and the critical question is which costs are fixed, which scale with customers, and which arrive before the revenue they support.
The canvas as a hypothesis map
The most productive way to run the exercise is to treat each filled box as a claim and mark its evidence state: measured, observed, or assumed.
Most first canvases are almost entirely assumed.
The next step is to rank the assumptions by two criteria: how much of the model depends on them, and how cheap they are to test.
Three kinds of assumption deserve priority:
Demand assumptions. That a segment exists, that it has the problem, and that it will change behaviour to solve it. These are usually tested with conversations and a small real offer, not with a survey of opinions.
Delivery assumptions. That the business can reach the segment at an acceptable cost, and that it can serve them reliably. These are tested with a small channel experiment and a real operational run.
Economic assumptions. That the price, retention, and cost structure produce a viable contribution. These are tested with arithmetic from measured inputs, as discussed in Why Many Startups Fail.
A canvas that has survived these three tests is no longer a diagram; it is a description of a business with evidence behind it.
Where the dependencies hide
The boxes are not independent, and the most dangerous assumptions are usually in the connections.
A value proposition that promises rapid support requires a cost structure that funds support, and a channel that brings in customers whose problems the support team can solve. A revenue model based on high volume needs a channel that delivers high volume, which may require partners who take a margin, which changes the economics again.
This is the same fit logic Porter describes in relation to activity systems: a position is defended by the way activities reinforce each other, and copying one piece without the rest produces a worse outcome. For a canvas, the practical test is to pick a box and ask what breaks elsewhere if you change it. If nothing breaks, the box is decorative.
Amazon's published company material is useful here as a worked example of a model expressed through operating decisions — the customer-led framing appears in how products are described and in how decisions are explained, not only in a stated proposition. The lesson is that the canvas should describe the same system the organisation actually runs.
Revenue and cash are different questions
A canvas records revenue streams and cost structure, and it often obscures timing. A subscription model and a project model can produce the same annual revenue with entirely different cash needs: the subscription collects in advance and carries a service obligation, while the project bills on delivery and may require funding the work first.
The Small Business Administration's lending guidance makes the financing side concrete. It notes that "loans backed by SBA make it easier for small businesses to access affordable financing", that Lender Match pairs borrowers with lenders, and that the terms are generally comparable to non-guaranteed loans. This is a reminder that a business model has to include how the gap between spending and collecting is funded — which is not the same as naming a revenue stream.
A worked example of a dependency
Consider a model that sells software to small retailers, with a self-serve channel, a monthly subscription, and onboarding provided by a partner.
The revenue box assumes retailers will pay monthly. The channel box assumes retailers will find the product online. The partner box assumes onboarding can be handled at a cost that leaves a margin. The cost box assumes support volume will be low because the product is self-serve.
Change one thing: the product turns out to require hands-on configuration. Now the partner must do more work, their cost rises, the margin falls, support volume rises anyway because configuration errors generate tickets, and the self-serve channel delivers customers the model cannot serve economically. No single box was wrong in isolation; the dependency between them was.
That is why the canvas is most useful when the team draws the arrows between boxes and asks where a change propagates.
A working session
- Fill the canvas with claims, not aspirations. Write what you believe is true, not what you would like to be true.
- Mark each claim as measured, observed, or assumed.
- Name the customer you refuse, and check that the rest of the canvas is consistent with that refusal.
- Draw the dependencies between boxes and circle the ones where a change would break something else.
- Rank assumptions by importance and test cost, then test the cheapest important one first.
- Record the date and evidence next to every assumption that changes.
- Revisit the canvas on a schedule, because a business model that changes without its map being updated will produce decisions based on a picture of an older company.
What the canvas cannot tell you
Three things are absent from a completed canvas, and all three can kill a business.
Competition. The canvas describes your model, not the alternatives the customer already has. A value proposition that sounds compelling in isolation can be ordinary against the customer's current workaround, and a channel that works for you may be saturated by competitors. Porter's argument is the right corrective: "a strategic position is not sustainable unless there are trade-offs with other positions". If your canvas has no statement of what you refuse, it has no position, and the boxes describe an intention rather than a strategy.
Timing. The canvas is static; markets are not. A model that depends on customers having a particular habit, budget, or infrastructure may be correct about the destination and wrong about the date. There is no box for "the market is not ready yet", which is why timing has to be examined separately as an assumption with its own evidence.
Execution. A model can be coherent on paper and fail because the organisation cannot perform the key activities reliably. The canvas names those activities but cannot tell you whether you are good at them, whether you can hire for them, or whether they will still be the right activities in a year.
The practical response is to keep the canvas beside three other documents rather than treating it as the business plan: a competitive analysis that names what customers would do without you, a dated list of timing assumptions with signals to watch, and an honest assessment of the capabilities the model requires. A canvas that has survived comparison with all three is a much more useful artefact than one that was filled in during a workshop and filed.
For the competitive position this model has to support, see How Companies Build Competitive Advantages; for the product side, see The Difference Between Building a Product and Building a Business.
A counterargument
A Porter-shaped critic would push back that the article still makes the canvas the centre of the analysis when the decisive questions sit outside it. The article concedes that competition, timing, and execution are absent, but then recommends testing the riskiest assumption inside the model - which presupposes you have already chosen a position worth testing. Porter's warning that "operational effectiveness is not strategy" cuts deeper than a missing box: a canvas full of measured, internally consistent, evidence-backed claims can still describe a business with no trade-offs and therefore no defensible position.
If a competitor can copy the whole diagram, the tests have confirmed only that the model works, not that it wins.
On this reading the canvas is useful bookkeeping downstream of a strategic choice, not the place that choice gets made.
References & Further Reading
- Colin Bryar and Bill Carr, 2019. Amazon Company News — Primary company material on how the working-backwards method is applied.
- Michael E. Porter, 1996. What Is Strategy? — The differentiation-versus-cost argument behind competitive-advantage analysis.
- National Retail Federation, 2026. NRF Press Releases | Latest Statements & Announcements | NRF — Primary retail-sales and channel data for sell-in versus sell-out definitions.