Income Statement Analysis Metrics that Matter
An income statement is a structured story about revenue and cost. Read the metrics that matter, a worked example, and where a clean figure hides the truth.
The income statement is often read as a single bottom line, which misses the structure that explains it: revenue, cost of goods, operating expenses, and the non-operating items below. The profitability article treats each layer as an accounting choice, as Reading Financial Statements Without an Accounting Background explains how figures are constructed, as Earnings Quality: Accruals, Estimates, and Red Flags warns about what a clean number hides.
Direct answer:
Analyse an income statement by reading each layer — revenue, gross margin, operating margin, and below-the-line items — with consistent definitions and the cash flow beside it.
Wikipedia's financial-statement entry provides the structure, and Damodaran's work insists on explicit assumptions. The boundary: this is educational orientation, not personalised advice — accounting standards and tax rules differ by jurisdiction and change, as the tax article requires a dated check, as the publication standard forbids guaranteed outcomes.
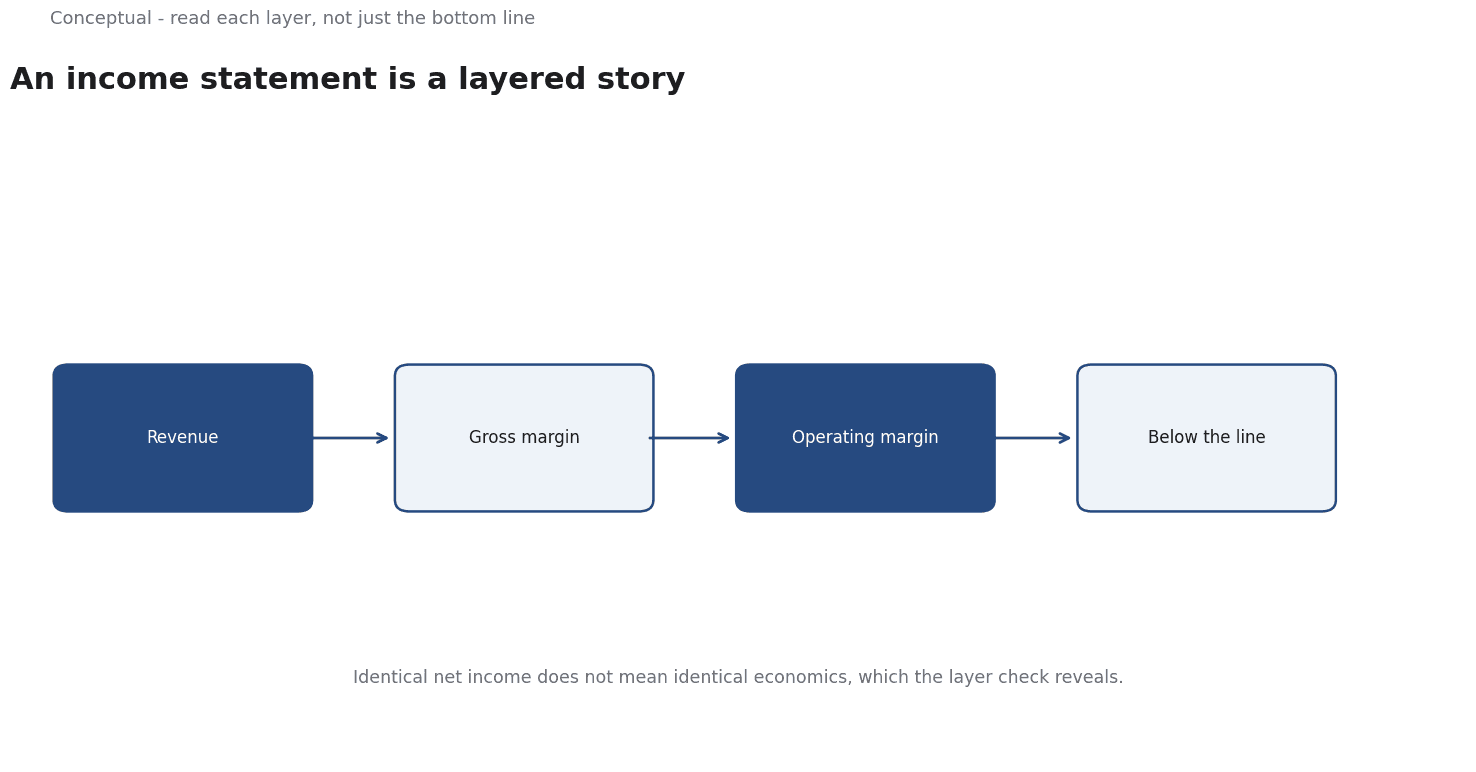
The metrics that matter
Revenue growth and mix. Growth is a starting question, not an answer, which the valuation article treats as conditional, as the comparables article requires consistent definitions, as the market-definition article advises on defining the market.
Gross margin. Revenue minus cost of goods sold, which the EBITDA article explains for what sits above and below the line, as the pricing article treats margin as a constraint, as the unit-economics article requires for contribution.
Operating margin. Gross profit minus operating expenses, which the EBITDA article treats as a place where non-cash charges appear, as the profitability article explains for capital intensity, as the cash-flow article requires for reconciliation.
Below-the-line items. Interest, tax, and one-offs can dominate net income, which the debt article treats as an obligation, as the tax article treats as jurisdiction-specific, as Earnings Quality: Accruals, Estimates, and Red Flags warns about estimates.
Three consequences follow. The definitions must be checked before comparing companies, as the comparables article requires, as Reading Financial Statements Without an Accounting Background advises. Profit should be paired with cash flow, as the free-cash-flow article advises, as Earnings Quality: Accruals, Estimates, and Red Flags warns about accruals. And the result should be read over several periods, as the monitoring article treats as evidence of a trend, as the decision-memo article requires for a recorded judgement.
A worked example
The following is hypothetical and illustrative. Two companies report the same net income, but one has high depreciation and interest expense while the other does not.
Three checks decide whether they are comparable. First, does each layer reflect the same accounting choices, as the EBITDA and profitability articles explain for depreciation and leases, as the comparables article requires consistent adjustments? Second, is the profit matched by operating cash flow, which the cash-flow article treats as working capital, as Earnings Quality: Accruals, Estimates, and Red Flags warns about accruals? Third, are below-the-line items recurring or one-off, as Reading Financial Statements Without an Accounting Background explains, as the tax and debt articles advise?
Three conclusions follow.
Adjustments matter more than the headline, as the comparables article advises. And the decision should be recorded with the definitions, as the decision-memo article requires.
What income statement analysis cannot do
It cannot establish a cause, which the causal-inference article treats as a different question, as the valuation article advises for conditional claims. It cannot predict a return, which investor education states, as Earnings Quality: Accruals, Estimates, and Red Flags warns about clean figures. And it does not replace an understanding of the business, which the company-analysis article treats as the prior step, as the value-proposition article argues for the buyer's evaluation.
The counterargument that the bottom line is all that matters is fair for a quick screen and wrong for a decision, which the worked example shows, as the comparables article argues for consistent adjustments.
A decision test
- Read each layer of the statement, as Reading Financial Statements Without an Accounting Background advises.
- Check definitions before comparing, as the comparables article requires.
- Pair profit with cash flow, as the free-cash-flow article advises.
- Examine below-the-line items, as Earnings Quality: Accruals, Estimates, and Red Flags warns.
- Read across several periods, as the monitoring article recommends.
- Treat a clean figure as a question, as Earnings Quality: Accruals, Estimates, and Red Flags advises.
- Record the decision and its limits, as the decision-memo article requires.
For the accounting basis, see Reading Financial Statements; for the quality question, see Earnings Quality.
References & Further Reading
- Wikipedia contributors, 2026. Financial statement - Wikipedia — An overview of the four financial statements and the purpose of each; a secondary reference used here with primary documents where available.
- Aswath Damodaran, 2026. Damodaran Online: Home Page for Aswath Damodaran — Publicly maintained datasets for industry averages, WACC, and valuation.