Leverage Ratios: Common Questions
Leverage ratios compare debt with equity or earnings. Read what each ratio measures, a worked example, and the questions it cannot settle on its own.
Leverage ratios attract confident answers to questions that are actually conditional. A single ratio can describe a firm's debt load, but it cannot say whether that load is safe without the cash flows, the terms, and the industry context behind it. Sorting the common questions starts with what the ratio measures and where that measurement stops.
Direct answer: Leverage ratios measure the extent to which a company uses borrowed capital, usually by comparing debt with equity, assets, or earnings. Wikipedia's leverage entry defines the general idea, and the balance sheet entry supplies the components the ratios draw from. They are screening tools for structure and risk, not verdicts on solvency, which depends on cash flow and terms the ratios omit.
Delta: This article adds a question-by-question framing beyond the sources: it maps each common leverage question to the specific decision it can support, with claim status made explicit.
The mechanism
The core concept is financial leverage, which the Wikipedia entry describes as the use of borrowed capital to increase potential return. The mechanism is simple: debt fixes a claim that must be met regardless of performance, so the same operating result produces a more variable return to equity when debt is present. The practical consequence is that leverage is about variability as much as about amount. Two firms with identical borrowings can face different risk if one has stable earnings and the other volatile ones, because the fixed claim interacts with the stability of the cash flows behind it.
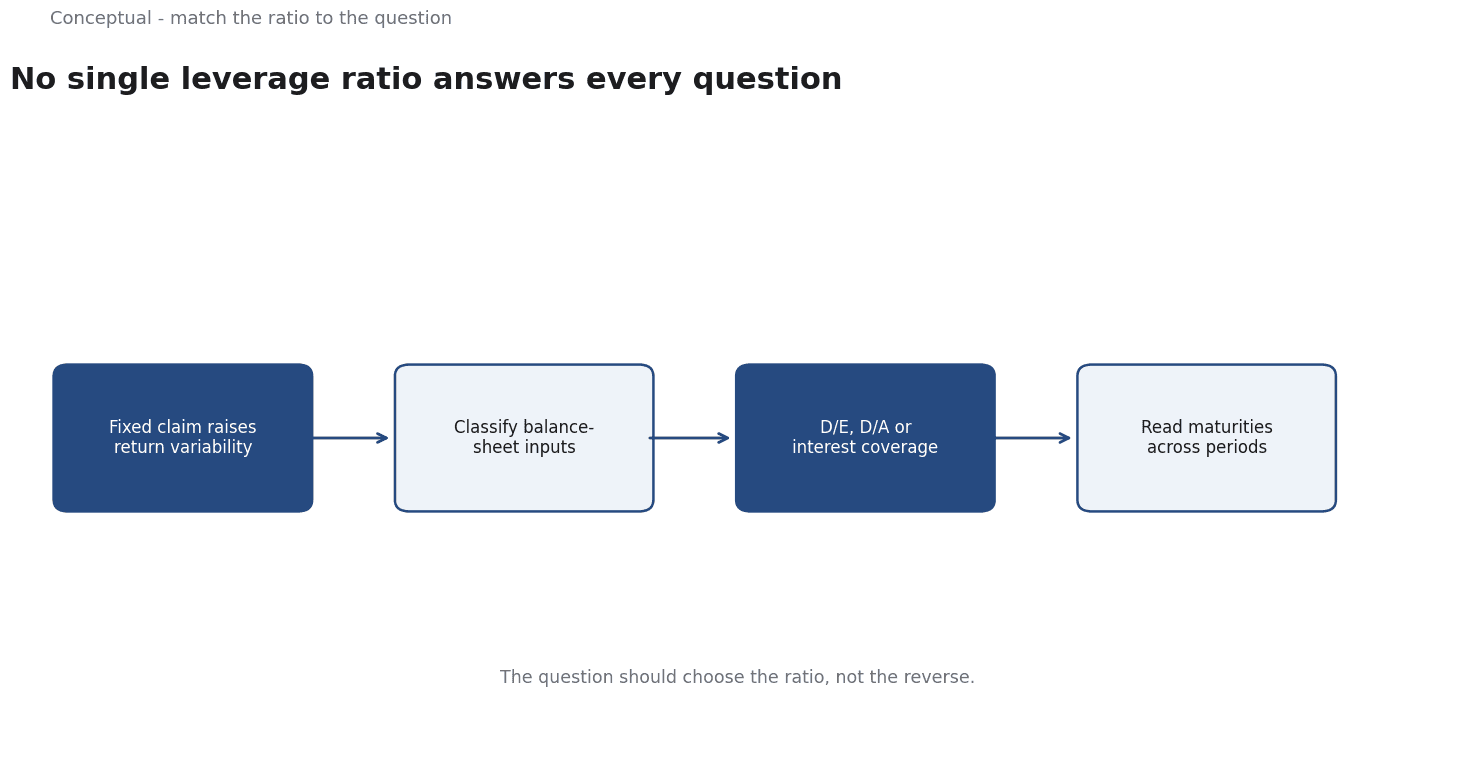
The second concept is the balance sheet, which the Wikipedia entry describes as a statement of assets, liabilities, and equity at a point in time. Leverage ratios are built from these components: debt over equity, debt over assets, or debt against earnings. The practical consequence is that a ratio is only as meaningful as the classification of its inputs. Whether a lease counts as debt, whether a pension obligation is included, and which earnings figure is used all move the number, so comparing ratios across firms requires checking that the definitions match before any conclusion is drawn.
A third idea is that different ratios answer different questions. Debt-to-equity speaks to capital structure; debt-to-assets to the share of the asset base funded by creditors; interest coverage to the ability to service debt from earnings. There is no single leverage ratio.
The practical consequence is that the question should choose the ratio, not the reverse.
Quoting a favourite ratio at every problem produces false comparisons, while matching the ratio to the decision keeps the measurement honest and the answer interpretable.
Finally, a balance sheet is a snapshot, not a motion picture. A ratio computed from it reflects one date, which can be unrepresentative if borrowing or repayment was concentrated near the reporting date. The mechanism therefore ends with a caution about timing: a leverage ratio should be read across several periods and alongside the maturity profile of the debt, because the risk lies not just in how much is owed but in when it comes due and what cash will be available at that moment.
A worked example
The following is hypothetical and illustrative. An investor is comparing two firms with similar debt-to-equity ratios and asks whether the leverage is equally risky. Three checks decide the answer. First, input definitions: does each firm classify leases and pension obligations the same way, so that the ratios are comparable at all? Second, earnings quality and stability: is the coverage ratio based on recurring operating earnings or on a one-off gain that will not repeat? Third, maturity profile: when does the debt come due, and can the cash flows service it in those years? The outcome is conditional. If one firm's earnings are volatile and its debt matures in a weak year, its identical headline ratio conceals greater risk. If both firms are stable and similarly defined, the ratios can be compared meaningfully rather than merely printed side by side.
Evidence status
| Claim | Status | Source | Verified | Recheck when |
|---|---|---|---|---|
| Leverage is the use of borrowed capital to raise potential return | source-reported | Leverage (finance) - Wikipedia | 2026-11-18 | Definition or treatment of leverage changes |
| A balance sheet reports assets, liabilities, and equity at a date | source-reported | Balance sheet - Wikipedia | 2026-11-18 | Accounting standards for these items change |
| Ratio validity depends on consistent input classification | inferred | Derived from the sources | 2026-11-18 | New guidance on cross-firm ratio comparability |
The two definitional claims are reported from the reference entries and are stable. The comparison claim is an inference, because the sources define the components but do not themselves rank firms. It should be revisited if accounting standards change how leases or obligations are classified, since that would alter whether two reported ratios are truly comparable and would invalidate a conclusion drawn from them.
What it cannot do
The first limit is that a leverage ratio is a snapshot of structure, not a measure of solvency. Solvency depends on whether cash flows can meet obligations as they fall due, and the ratio contains no information about timing or liquidity. A firm can carry a moderate-looking ratio and still face a crisis if its debt matures in a single thin year. The concept cannot see the maturity ladder, so any claim that a low ratio guarantees safety is a category error. It describes a relationship between balance-sheet items at one date and leaves the dynamics of repayment entirely outside its frame.
A hidden cost sits in the definitions. Debt can be measured gross or net of cash, leases can be capitalised or excluded, and earnings can be reported before or after one-off items. Each choice is defensible, but together they let a ratio be tuned to tell a flattering story. The cost is not in the arithmetic but in the comparison: two parties using different conventions can quote different ratios from the same company and each believe they are being precise. The disagreement is about definitions, yet it surfaces as a dispute about numbers, which makes it harder to resolve.
A capital-intensive utility and a software company can have legitimately very different leverage because their asset bases and cash-flow stability differ. Importing a single acceptable range ignores that context and mislabels normal structures as risky or risky ones as normal. The measure fails when it is used as a universal threshold rather than as a comparison within a peer group facing similar economics. A ratio detached from its peer group is a number without a reference point.
There are boundaries where leverage ratios should not be the primary tool. For financial institutions, where leverage is the business model and liabilities are raw material, ordinary non-financial ratios are misleading. For early-stage firms with minimal earnings, earnings-based ratios are unstable or undefined. In both cases other measures carry the signal, and forcing a standard ratio into the analysis obscures more than it reveals. recognising the boundary is part of using the tool responsibly rather than mechanically.
Finally, leverage needs review because both the firm and the conventions move. Borrowing changes with financing decisions, accounting standards shift the classification of inputs, and a ratio that was comparable last year may not be today. The practical requirement is to read the ratio across several periods, to fix a consistent definition before comparing firms, and to record which conventions were used. Without that, the ratio becomes a number people cite rather than a measure they can defend, and the comparison quietly loses its foundation over time.
The counterargument that leverage ratios are too blunt to be useful is fair for cross-industry screening and incomplete within a stable peer group, where consistent definitions turn the ratio into a genuine comparative signal.
A decision test
- State the specific question the ratio is meant to answer.
- Choose the ratio that matches the question, not a favourite default.
- Fix definitions for debt, leases, and earnings before comparing.
- Read the ratio across several periods, not one date.
- Check the debt maturity profile against expected cash flows.
- Compare only within a peer group with similar economics.
- Record the conventions used and the decision the ratio informed.
Leverage ratios are most useful when they narrow a question rather than settle it. A defensible reading names its definitions, respects the peer group, and admits what the snapshot leaves out. The discipline is small but it changes the ratio from a headline into evidence that can be checked. For further reading, see Decision Memos That Survive Review.
References & Further Reading
- Wikipedia contributors, 2026. Leverage (finance) - Wikipedia — The use of debt and the ratios used to measure it.
- Wikipedia contributors, 2026. Balance sheet - Wikipedia — The structure of assets, liabilities and equity, and the accounting equation that must balance.