Microeconomics for Decision Makers: Supply, Demand, and Elasticity
Elasticity is a decision tool, not a diagram. Read how it determines pricing, revenue, and which cost changes a business can pass on.
Microeconomics is often taught as a set of curves, and the curves are useful, but the thing that actually travels into a business decision is elasticity. It is the number that determines whether a price rise increases or decreases revenue, whether a supplier's cost increase can be passed on, and whether a product is a luxury or a necessity in the eyes of the people buying it.
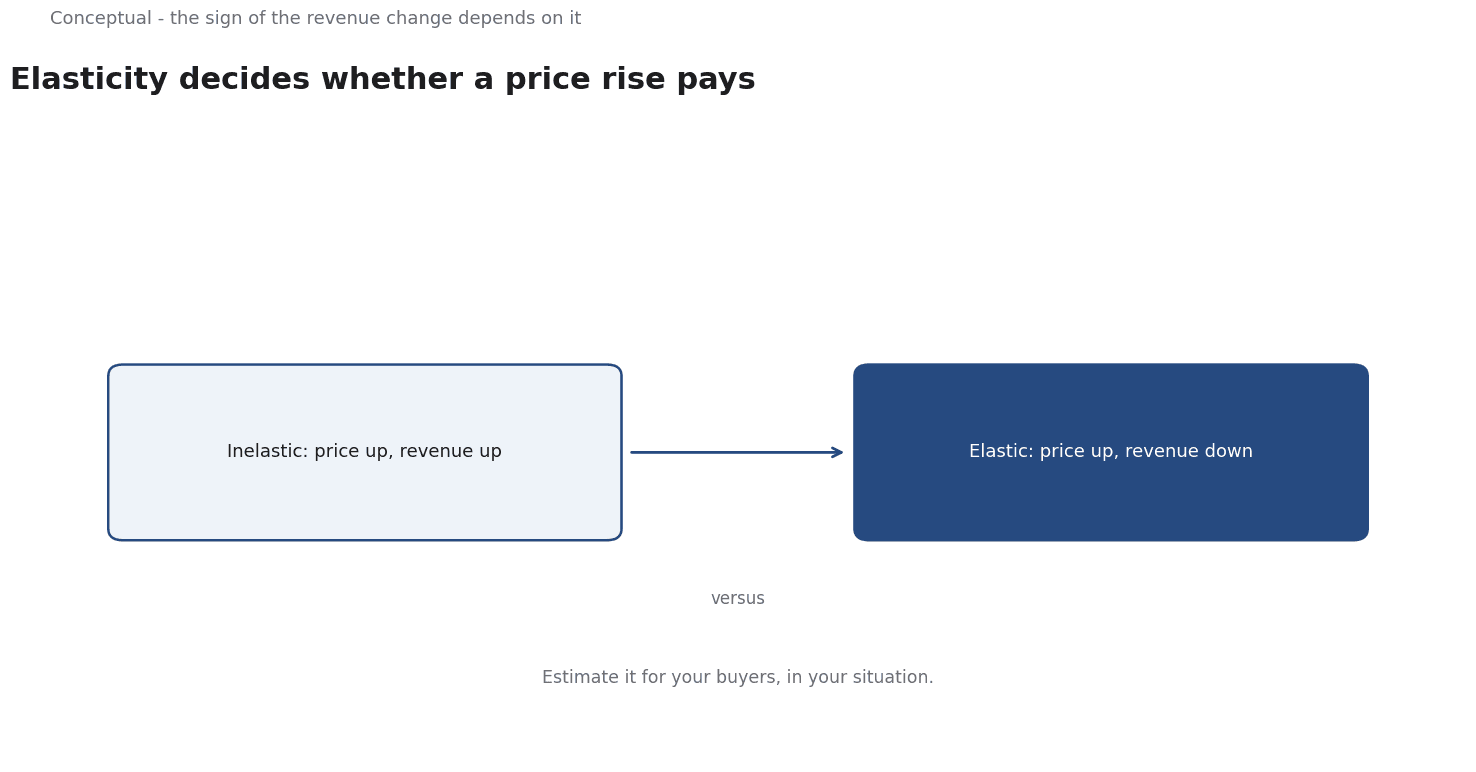
Elasticity measures how much quantity responds to a change in price — and the business consequence is that the sign of a revenue change depends on it.
Direct answer: When demand is inelastic, a price rise raises revenue; when it is elastic, the same rise lowers it. The number is not a property of the product alone but of the buyer, the alternatives available, the time horizon, and the share of income or budget involved. The practical work is to estimate it for your customers in your situation rather than inherit a textbook assumption.
The curves are a story about constraints
The core open-access textbook The Economy 2.0: Microeconomics from CORE Econ exists precisely to make these ideas usable for decision-making rather than exam-answering, and its framing is worth adopting: the models are simplified descriptions of how buyers and sellers respond to constraints, not photographs of a market.
Supply and demand are the simplest such description. A price is not chosen by one side; it emerges from where buyers' willingness to pay and sellers' willingness to supply meet. When something shifts that intersection — an input cost, a change in income, a new substitute — the new equilibrium is a consequence, not a decision anyone made.
It is not. It is a point on a relationship, and the relationship determines what happens when you move it.
Why elasticity is the number to know
Elasticity of demand answers the question: if price changes by one percent, what happens to quantity demanded? The revenue consequence follows directly.
- If demand is inelastic (quantity responds less than proportionally), a price rise increases total revenue, because the extra revenue per unit outweighs the units lost.
- If demand is elastic, a price rise decreases total revenue.
- At unit elasticity, revenue is roughly unchanged.
The same logic applies to costs. When an input price rises, how much of it you can pass on depends on how elastic your customers' demand is and how elastic your suppliers' supply is. A business facing inelastic customers and elastic suppliers can absorb a cost shock by raising prices; one facing the reverse cannot.
Four things determine elasticity in practice:
Availability of substitutes. A product with close substitutes has elastic demand; one without has inelastic demand. This is why a commodity supplier has far less pricing power than a differentiated one, and it connects directly to Porter's argument that a defensible position is built on trade-offs that make substitution difficult.
Share of the buyer's budget. A small item that is bought rarely tends to have inelastic demand; a large recurring purchase attracts attention and comparison.
Time horizon. Demand is usually more elastic over a longer period, because buyers can change habits, find alternatives, or redesign their process. A short-run price rise may preserve revenue and quietly lose customers who leave next year.
The definition of the market. "Soft drinks" has more substitutes than "cola", which has more than your specific brand. Elasticity is a property of how narrowly you draw the category, and a pricing analysis that uses the wrong category produces the wrong number.
Estimating it without pretending to certainty
There are three practical ways to get an elasticity estimate, in increasing order of reliability.
Ask the customer. Conjoint and choice experiments ask buyers to choose between hypothetical alternatives with different attributes and prices. The result is a stated-preference estimate — useful for new products where no history exists, and weaker where respondents say one thing and buy another. AAPOR's research standards are relevant here: a survey result should record who was asked, how they were selected, and what the sample can support.
Look at natural variation. Past price changes, regional differences, and competitor actions create variation you can analyse. The problem is that prices are rarely changed randomly, so a naive regression confounds the price with the reason it changed — a discount offered because demand was weak will make demand look more elastic than it is.
Run a controlled price experiment. Randomise the price offered to comparable customers and measure what happens. This gives the cleanest causal estimate, and it is subject to the same design constraints as any experiment — enough sample, a fixed horizon, and a decision rule set in advance. CUPED's reported reduction of variance by about 50% using pre-experiment data is directly relevant, because demand can be noisy enough that a modest elasticity is undetectable without variance reduction.
Where the macro data comes in
The Federal Reserve Bank of St. Louis's FRED database makes series available with their release dates attached, which is what allows a business to distinguish "costs rose" from "costs were revised upward later". For elasticity work, the relevant series are usually indices of input prices, wages, and consumer spending — the external conditions that shift demand or supply while you are trying to measure a price response.
The discipline is the same one used in macro work: record the vintage. A demand estimate built from six months of data whose definitions changed halfway through is not a demand estimate, and the change in definition is rarely visible in the final number.
A decision sequence
- Define the market from the buyer's point of view, not from your product catalogue. Substitutes are what the customer considers, not what your competitors list.
- Name the time horizon of the decision. A pricing change that must hold for a year needs a long-run elasticity.
- Choose an estimation method and state its limits — stated preference, historical variation, or experiment.
- Compute the revenue consequence, not just the elasticity. The number is only useful when it changes a decision.
- Check the pass-through question for any cost change. Whether you can raise price depends on your customers' elasticity and your suppliers'.
- Re-estimate after the decision. A price change is itself an experiment, and its result is the cheapest data you will ever get.
For the pricing application, see Pricing Strategy; for the competitive-advantage question underneath substitutes, see How Companies Build Competitive Advantages.
A counterargument
The article sells elasticity as a number you can go and measure, but its own estimation ladder undercuts that confidence: stated-preference answers are "weaker where respondents say one thing and buy another," historical variation is confounded because prices are rarely changed randomly, and controlled experiments need enough sample to detect a modest effect. A critic would add that the quantity is definition-dependent - elasticity shifts between "soft drinks," "cola," and a specific brand - so a chosen category can smuggle in the desired conclusion, despite the advice to define the market from the buyer's view. The revenue rule also assumes a static cost base, while the FRED discussion shows series whose definitions change mid-history.
The objection is not that elasticity is useless but that the piece hides how much judgement sits behind the number.
References & Further Reading
- Econlib, 2026. Core Econ: The Economy — A complete free economics textbook covering supply, demand, and elasticity.
- Federal Reserve Bank of St. Louis, 2026. FRED economic data — The primary time-series database used for macro indicators.