NPS and Its Discontents: What the Score Does Not Say
A single number is easy to track and easy to misread. Read what NPS measures, a worked interpretation, and what to use alongside it.
The Net Promoter Score reduces customer sentiment to one number between -100 and 100. That simplicity is why it appears on board decks everywhere, and why it is frequently over-interpreted. The score records an answer to one question; it does not explain why, and it is not a forecast of growth.
Direct answer: NPS measures the balance of respondents who would recommend a company to a friend or colleague, on an 0–10 scale, grouped into promoters, passives, and detractors. AAPOR's standards govern the survey behind it — population, wording, and sampling decide whether the number means anything. The boundary: the score does not measure actual referral behaviour, is sensitive to sample composition, and cannot tell you what to fix, which the voice-of-customer article argues for turning feedback into decisions.
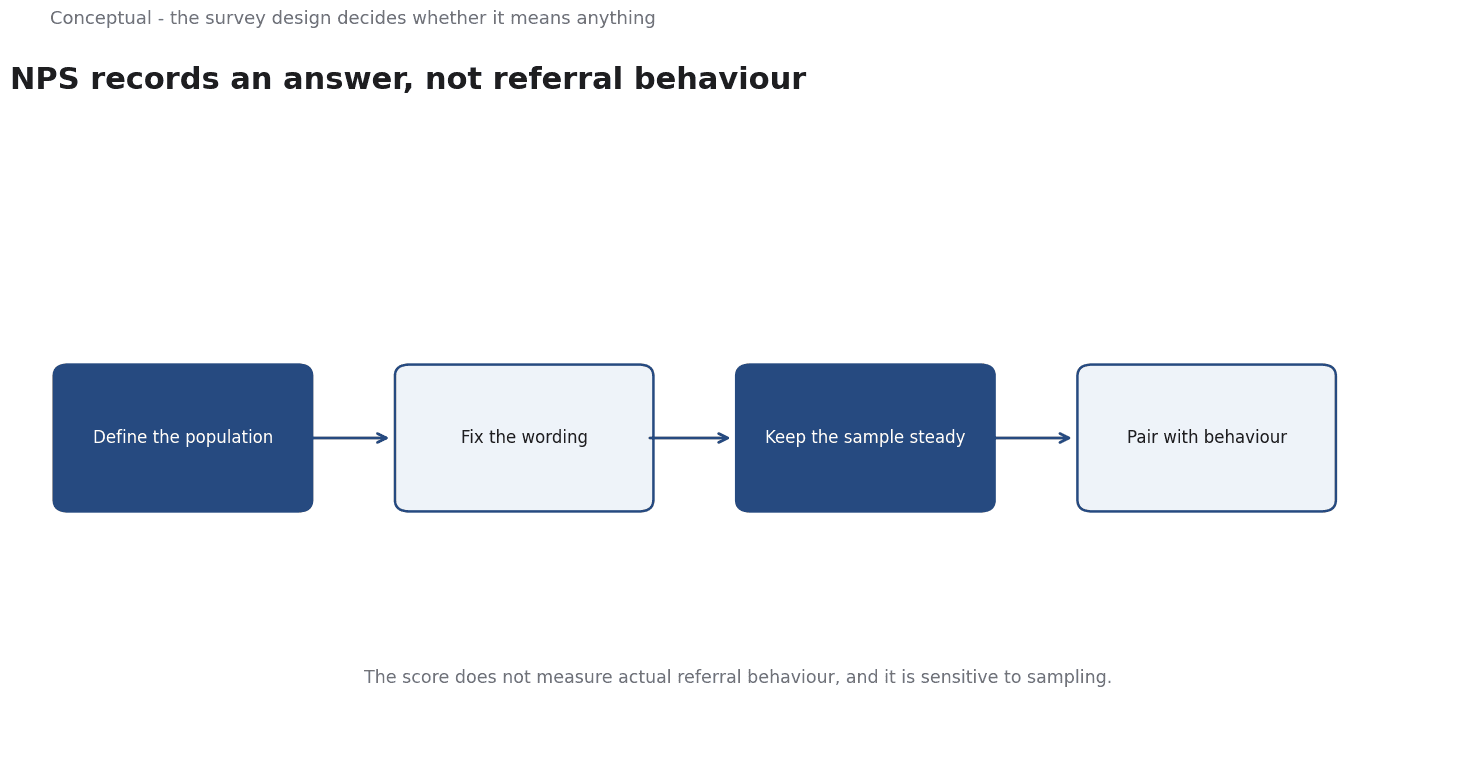
What the score captures
A stated intention. Asking "how likely are you to recommend?" records a reported attitude, not an observed action, which the AAPOR standards require you to state as such.
A distribution summarised. Promoters minus detractors collapses a richer set of answers into one figure, which the email-metrics article warns about for aggregate proxies.
A snapshot of respondents. Who was asked and when determines the result, which the survey standards make central.
A worked interpretation
The following is hypothetical and illustrative.
A company reports an NPS of 40, up from 30 a year ago. Three checks decide what it means:
- Sample composition. Was the survey sent to all customers or to a segment? If only engaged customers responded, the score is biased, which AAPOR's standards require you to disclose. Suppose the response rate was 12% — the result describes respondents, not the base.
- What changed. Did the score rise because detractors decreased or promoters increased? The same net figure can hide opposite shifts, which the email-metrics article treats as a reason to report distributions.
- Behavioural check. Did referrals actually increase, as the referral article measures with rewards and holdouts? If stated intention rose but behaviour did not, the score is a weak proxy, as the attribution article warns about credit rules.
Three conclusions follow:
- The number alone is not a result, which the evaluation-rubric article argues for concrete evidence.
- The distribution and the sample matter more than the net, as the survey standards require.
- **The follow-up question — why? — is where value lies, which the voice-of-customer article treats as turning feedback into decisions.
What to use alongside it
The open-ended reason. Ask why a respondent gave that score and group the answers by theme, as Voice of Customer: Turning Feedback into Decisions recommends.
Behavioural metrics. Retention, repeat purchase, and referral conversion are observed, which the retention and referral articles cover as outcomes rather than intentions.
Segment cuts. A single average hides a problem in one group, which the customer-segmentation article argues for real differences.
The counterargument — that NPS is useless — is too strong.
It is a simple, consistent signal for tracking direction over time within one organisation, provided its limits are stated, as the brand-awareness article argues for signals with a defined scope.
Keeping the survey honest
The value of a trend depends on the survey staying comparable. Three practices protect it:
Fix the wording. Changing the question, even slightly, breaks the series, which AAPOR's standards require for valid comparisons over time.
Fix the population.
Report the sample with the score. A number without a response rate and a population is hard to interpret, which the email-metrics article argues for denominators.
These practices are unglamorous and determine whether the score is a signal or noise, which the evaluation-rubric article treats as the difference between a metric and a measurement.
What NPS cannot do
It cannot forecast growth. Stated intention and actual behaviour differ, which the referral article treats as a central measurement problem.
It cannot tell you what to fix. That requires the reason and the behavioural data, as Voice of Customer: Turning Feedback into Decisions explains.
It cannot compare across cultures without care. Response styles differ by region, which the survey standards treat as a wording and context issue.
A decision test
- State the population and response rate with every score, as AAPOR's standards require.
- Report the distribution, not just the net, as the email-metrics article advises.
- Ask why and group answers by theme, as Voice of Customer: Turning Feedback into Decisions recommends.
- Compare with behaviour — retention and referrals, as the retention and referral articles cover.
- Cut by segment to find hidden problems, as the customer-segmentation article argues.
- Keep wording stable over time, which the survey standards require for trend validity.
- Treat the score as a signal, not a verdict, as the evaluation-rubric article advises.
For the feedback loop, see Voice of Customer; for the survey standard, see AAPOR.
References & Further Reading
- American Association for Public Opinion Research, 2026. AAPOR — The professional association for public opinion and survey research; its standards and resources underpin the survey-design discussion.
- Wikipedia contributors, 2026. Demand generation - Wikipedia — An overview of demand generation as a marketing discipline distinct from lead generation; secondary reference used with the lead-generation entry.