Page Speed Examples
How Core Web Vitals turn page speed into measurable user outcomes, what the thresholds really mean, and where a single number can mislead a decision.
Page speed is often discussed as a single score, which hides the fact that loading, interactivity, and visual stability fail in different ways. A site can paint quickly yet ignore taps, or look stable until an image shifts the layout under the user's finger. Core Web Vitals separate these failure modes into distinct metrics, and that separation is what makes the numbers useful for decisions.
Direct answer: Core Web Vitals are a set of metrics that measure real-world loading, interactivity, and visual stability; the key ones are Largest Contentful Paint, Interaction to Next Paint, and Cumulative Layout Shift. The practical decision is which metric to fix first, based on the user action the page actually supports, rather than on which number looks worst in a lab tool.
Delta: This article adds a prioritization frame beyond the sources: it maps each vital to the user action it protects, so a metric becomes a decision about what to fix, with claim status explicit.
The mechanism
Web Vitals is an initiative to give site owners a shared set of measures for real user experience. The Core Web Vitals focus on three things: loading, interactivity, and visual stability. Largest Contentful Paint, or LCP, reports when the largest content element finishes rendering; Cumulative Layout Shift, or CLS, captures unexpected movement of visible elements; and Interaction to Next Paint, or INP, reports responsiveness. The practical consequence is that a team can diagnose the kind of problem before choosing a fix, instead of treating every complaint as a generic need to go faster.
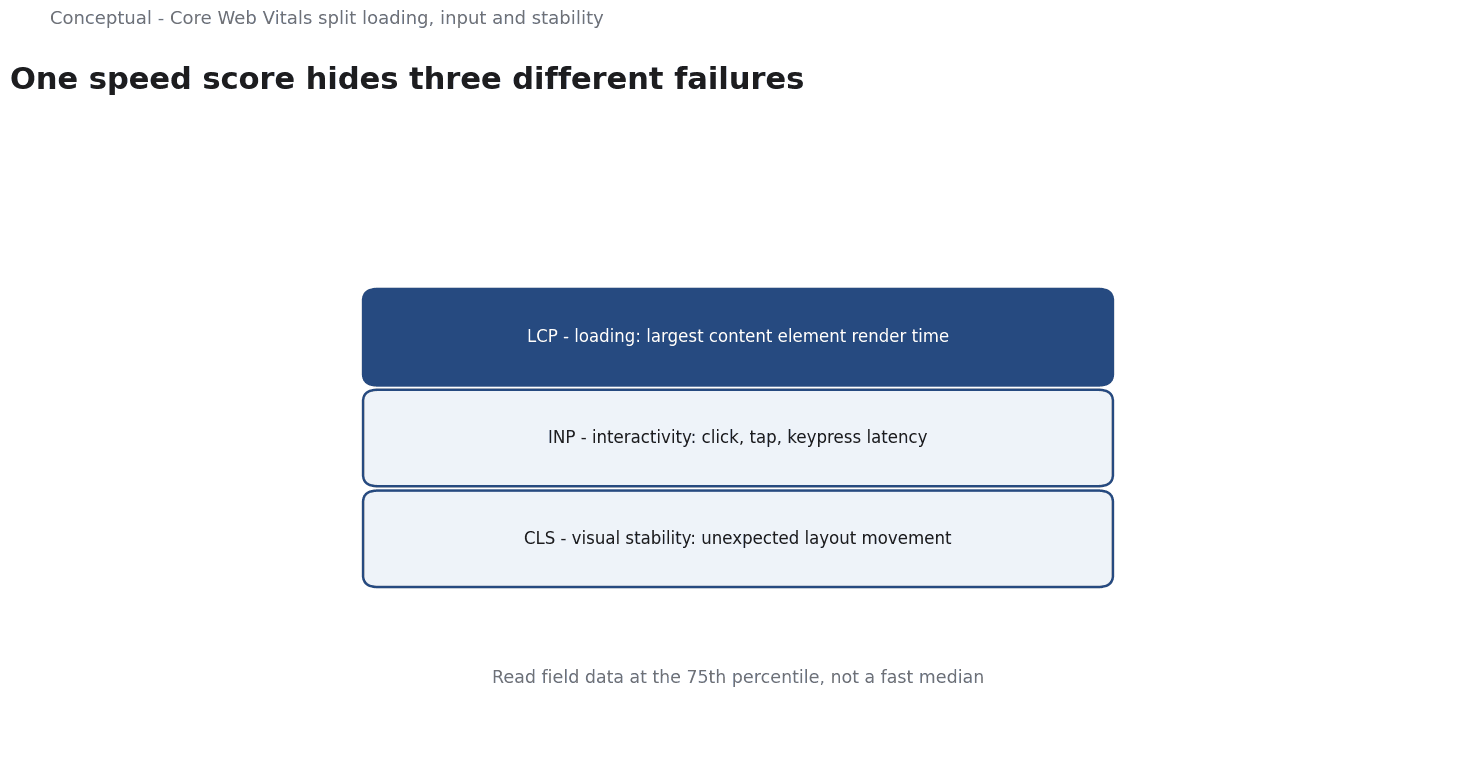
INP deserves specific attention because it changed what responsiveness means in practice. It measures the latency of user interactions such as clicks, taps, and keyboard input, looking at how long the page takes to respond and paint the next frame. It replaced First Input Delay as a Core Web Vital, moving the focus from the start of processing to the full interaction. The practical consequence is that long tasks blocking the main thread now surface as a user-visible number, so work that delays a handler cannot be hidden behind a fast initial load.
LCP and CLS translate design choices into timing and stability. LCP is sensitive to slow servers, large images, and render-blocking resources, so it responds to changes in how the primary content is delivered. CLS is driven by elements that move after they appear, such as images without reserved space or ads injected late. The practical consequence is that fixes are concrete: size images, reserve layout space, and prioritize the content element that defines the page's main purpose.
The final piece is how the numbers are read. Web Vitals guidance emphasizes field data from real users and uses a percentile, commonly the 75th, so the reported value reflects a slower experience rather than a fast median. The practical consequence is that optimizing for the aggregate hides the users the page serves worst. A healthy target is one that holds across the distribution, which is why a lab run on a fast machine is a poor substitute for measurement taken from real sessions.
A worked example
The following is hypothetical and illustrative. A checkout page loads its main content quickly but users report that tapping the address field feels sluggish. Three checks frame the response. First, read the field data: LCP is acceptable while INP is the lagging vital, so the problem is interactivity rather than loading. Second, inspect the interaction path: a validation script runs a long task on the main thread when the field gains focus, delaying the next painted frame. Third, confirm the distribution: the delay is concentrated among slower devices, consistent with a 75th-percentile view rather than an outlier. The outcome is a decision to defer that validation work off the critical interaction path, then remeasure INP from field data. The example is illustrative, but it shows how naming the right vital turns a vague speed complaint into a scoped change with a measurable target.
Evidence status
| Claim | Status | Source | Verified | Recheck when |
|---|---|---|---|---|
| Core Web Vitals cover loading, interactivity, and visual stability | source-reported | web.dev Vitals | 2026-11-18 | Metric set is revised |
| INP measures interaction latency and replaced First Input Delay | source-reported | web.dev INP | 2026-11-18 | Guidance on INP changes |
| Choosing the vital tied to the primary user action yields the largest perceived gain | inferred | Derived from the sources | 2026-11-18 | Page interaction model changes |
The source-reported rows capture what the metrics measure and how the interactivity vital evolved. The inferred row is a prioritization rule derived from those definitions, not a claim the sources make directly, and it should be tested against field data for the page in question. Recheck the table when the metric set or the page's primary interaction changes, since either shift changes which number deserves attention first.
What it cannot do
A speed metric does not tell a team what users value. A fast page for a task nobody completes is still a failed page, and improving a vital that is already healthy may produce no perceptible benefit. The numbers describe the timing and stability of rendered output; they say nothing about whether the content is correct, the offer is relevant, or the flow leads anywhere useful. Treating a green metric as proof of a good experience confuses a necessary condition with a sufficient one, and it can divert effort from problems the metric set does not represent.
The hidden cost is the instrumentation and the interpretation. Collecting field data requires a measurement setup, and reading it well requires understanding percentiles, device mix, and the difference between a page load and a later interaction. Teams often optimize the metric that is easiest to move rather than the one that constrains users, because the easy one has an obvious fix. That tendency is expensive: it consumes engineering time while the real bottleneck stays in place, and the dashboard looks better even when the experience does not.
A change that improves a score in a controlled run can leave real users unaffected, because lab conditions exclude the slow devices, cold caches, and network variability that field data captures. The reverse also happens: a genuine improvement can look small in a lab because the baseline there was already favorable. The result is a feedback loop that rewards the wrong work, which is why field measurement is the reference point and lab tools are best used for diagnosis rather than verification.
There is a boundary around what these metrics cover. They address loading, responsiveness, and visual stability, not accessibility, not content quality, and not the business outcome of a visit. A page can pass every vital and still be unusable with a keyboard or confusing to navigate. The source material defines a performance slice of experience, not experience as a whole, so the vitals should be read as one input among several rather than a complete quality score.
Because of these limits the numbers need review in context. Thresholds and guidance can change, and a page's primary interaction can change with a redesign, which alters which vital matters most. A team should revisit the measurement setup when the page changes materially and should pair the vitals with direct evidence about whether users complete their tasks. Without that pairing, the risk is a well-measured page that is fast, stable, and unsuccessful.
Counterargument: the claim that Core Web Vitals are the wrong focus is fair when the bottleneck is content or accessibility, and incomplete when slow loading or delayed input is demonstrably blocking users from completing a task.
A decision test
- Identify the primary user action on the page and the interaction that must feel immediate.
- Pull field data for the page and record LCP, INP, and CLS at the recommended percentile.
- Determine which vital is the lagging one for the slowest meaningful slice of users.
- Trace that vital to a concrete cause, such as a long task, a large image, or an unreserved layout space.
- Check whether the proposed fix changes the field measurement, not only a lab score.
- Remeasure after release and compare against the same percentile and device view.
- Revisit the choice of vital whenever the page's primary interaction or layout changes.
These steps convert a speed concern into a bounded investigation. If step one is unclear, there is no basis for choosing which vital to improve, because priority depends on what the page is for.
The test keeps the team anchored to real-user measurement and to the interaction that matters, so a number only counts when it reflects something a user actually experiences.
For further reading, see Marketing dashboards without the hype.
References & Further Reading
- web.dev, 2026. Web Vitals — The Core Web Vitals thresholds and what each metric measures.
- web.dev, 2026. Interaction to Next Paint (INP) - web.dev — Core Web Vitals metric for interaction responsiveness.