Retail Analytics Costs Explained
Analytics has a cost beyond the licence. Read where it comes from, a worked budget, and why a dashboard is not a decision.
Retail analytics is often budgeted as a software line, which hides the cost of collecting, cleaning, and interpreting the data. The Census e-commerce series provides channel context, and the web-analytics entry describes collection and interpretation. The question is what a measurement system costs end to end.
Direct answer:
Count the full cost — collection, storage, cleaning, tooling, and people — and judge it by the decisions it changes.
The sources provide the context; the budget method is a synthesis.
Delta: This article adds a claim-status table and a worked budget, separating the documented purpose of analytics from the local cost decisions that determine whether it pays.
The mechanism
Three cost layers are easy to miss:
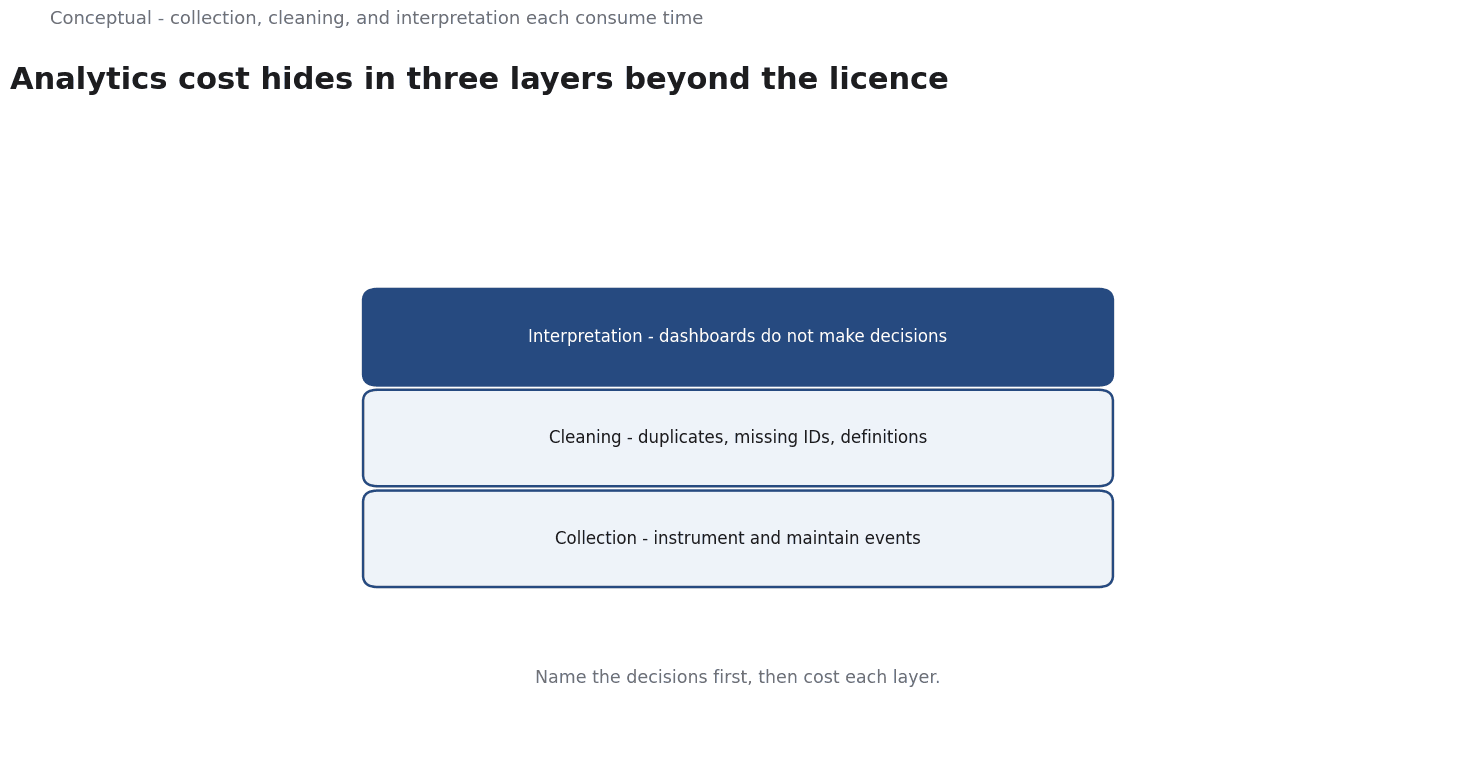
- Collection. Events must be instrumented, and instrumentation has to be maintained as the site changes. The web-analytics entry describes collection as an active process.
- Cleaning. Duplicate events, missing identifiers, and inconsistent definitions consume time. This is a data-quality problem before it is a reporting problem.
- Interpretation. A dashboard does not make a decision. The dashboard literature argues for metrics tied to decisions, which is a practical rule rather than a measurement fact.
The budget sequence is: name the decisions, list the data they require, then cost each layer. Naming decisions is local judgement, so that step is inferred; the purpose of analytics is source-reported.
A worked budget
Illustrative. A retailer wants to understand why conversion varies by channel.
Three checks decide. First, which decision would change — spend allocation, page design, or stock — and what data does that decision need? Second, which events already exist and which require new instrumentation, with a maintenance cost? Third, how much analyst time is needed to keep definitions consistent and interpret the result?
The outcome is a budget with a decision attached. The numbers are hypothetical; the method is the contribution.
Why cost belongs in the measurement design
A metric that costs more to maintain than the value of the decisions it informs is a poor metric, however accurate. Retail teams often discover this only after a dashboard has become part of a weekly routine and nobody can say what decision it changed. Counting the full cost early makes that question unavoidable.
Instrumentation is the largest hidden cost in many cases. An event is not merely added once; it must survive redesigns, template changes, and new channels. Each change is an opportunity for the event to stop firing or to fire differently. A team that tracks instrumentation as a maintenance queue treats it as a real system.
Data cleaning is the second hidden cost. Events arrive duplicated, late, or with missing identifiers, and each defect requires someone to notice it and decide what to do. The work is invisible in a licence comparison but visible in the analyst's calendar. Counting it explicitly turns an abstract budget into a concrete staffing question.
Interpretation is the third. A number becomes useful only when someone connects it to a decision and states what would change. That work cannot be automated away by a tool, because deciding which metric matters is a judgement about the business. A budget that omits interpretation time is a budget for charts rather than for analysis.
The practical result is a simple rule: write the decision before the dashboard. If no decision can be named, the cost has no counterpart, and the project should be reconsidered.
Evidence status
| Claim | Status | Source | Verified | Recheck when |
|---|---|---|---|---|
| E-commerce has measurable channel activity | source-reported | U.S. Census Bureau | 2026-11-18 | New series released |
| Web analytics covers collection and interpretation | source-reported | Wikipedia, Web analytics | 2026-11-18 | Definition revised |
| Budget by decision before buying tools | inferred | Derived from the stated purpose | 2026-11-18 | Decision set changes |
Why the hidden costs matter
Instrumentation decays. A site change can silently break an event, and the resulting gap is usually discovered weeks later when a report looks wrong. Maintaining instrumentation is therefore a continuing cost, not a one-time setup cost. A budget that counts only the licence will understate the real spend.
Definitions decay too. Two teams can use the same metric name for different events, and a dashboard that mixes them will produce a number nobody can act on. Keeping definitions consistent is analyst work, and it recurs whenever the product changes.
What it cannot do
It cannot guarantee better decisions; it only supplies information. It does not replace domain knowledge, which determines what a number means. And it cannot remove the need to check the data against reality.
The counterargument that a tool solves measurement is fair for collection and incomplete for interpretation.
A decision test
- Name the decision the analytics should support.
- List the data it needs.
- Count collection and maintenance costs.
- Count cleaning and definition work.
- Count interpretation time.
- Verify against a real decision.
- Record the budget and the recheck condition.
For the measurement context, see Marketing Dashboards.
References & Further Reading
- U.S. Census Bureau, 2026. Quarterly Retail E-Commerce Sales — The official definition and estimates for retail e-commerce sales.
- Wikipedia contributors, 2026. Web analytics - Wikipedia — Collection and interpretation of website behaviour data.