Sharpe Ratio Metrics that Matter
The Sharpe ratio measures return per unit of volatility, but it is easy to misuse. Learn how diversification changes the denominator, with a worked example and limits.
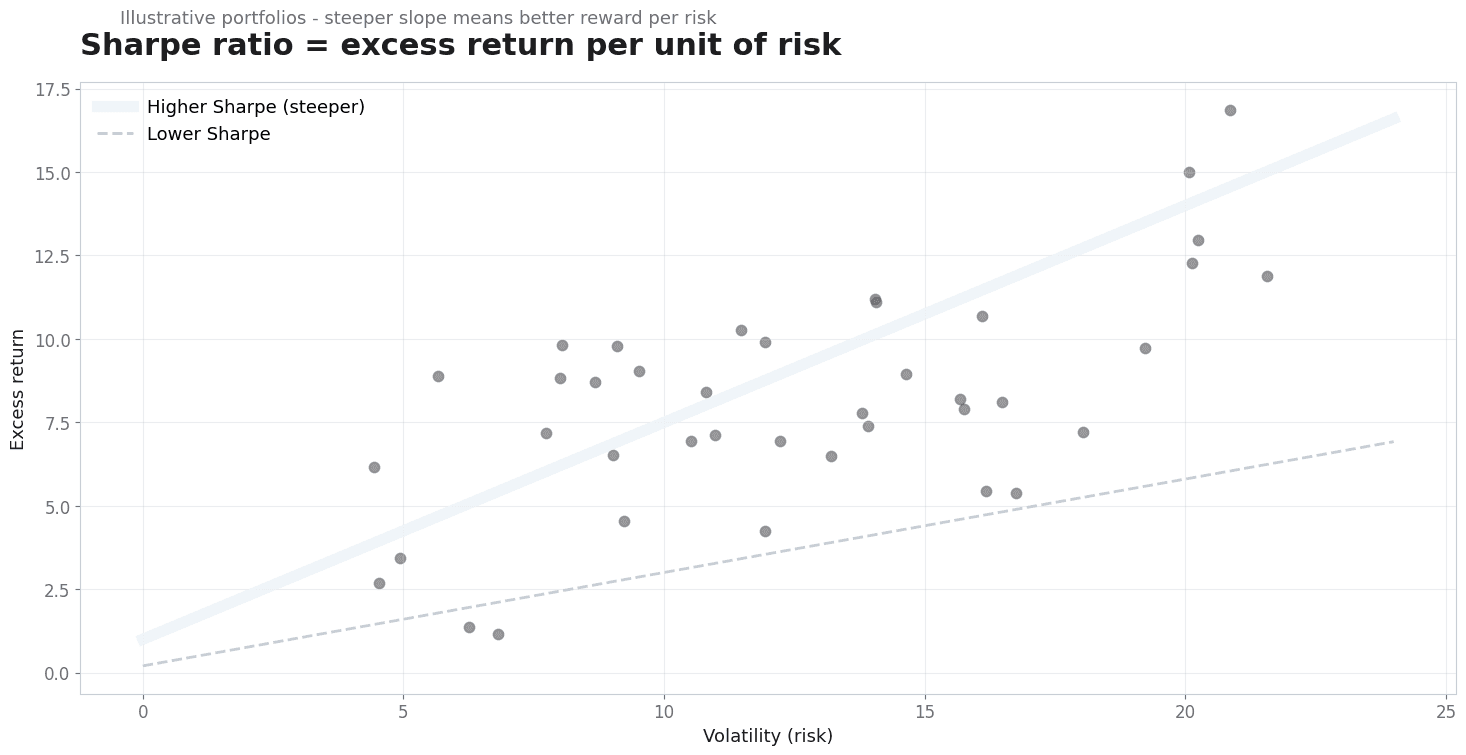
Portfolio reviews often quote a Sharpe ratio as if it were a complete verdict on performance. The Sharpe ratio entry defines it as excess return per unit of volatility, and the diversification entry explains how combining assets changes portfolio risk. The real problem is that the number is sensitive to what goes into both its numerator and its denominator.
Direct answer: The Sharpe ratio divides excess return over a risk-free rate by the standard deviation of returns, so it measures return per unit of total volatility. Diversification can lower that volatility without changing expected return, raising the ratio. The sources define the measure and diversification; they do not set a benchmark for a good value.
Delta: This article adds a numerator-denominator map beyond the sources: it maps each input of the ratio to the portfolio decision that changes it, with claim status explicit.
The mechanism
The Sharpe ratio is defined as the difference between the portfolio return and a risk-free rate, divided by the standard deviation of the portfolio's returns. The result expresses excess return per unit of volatility, and a higher value indicates more return for each unit of risk as the measure defines it. The practical consequence is that three inputs shape the number: the chosen risk-free rate, the observed return, and the estimated volatility. Volatility here is total volatility, so it counts upward movement alongside downward movement. A manager who reads the ratio as a measure of downside only has misunderstood the denominator.
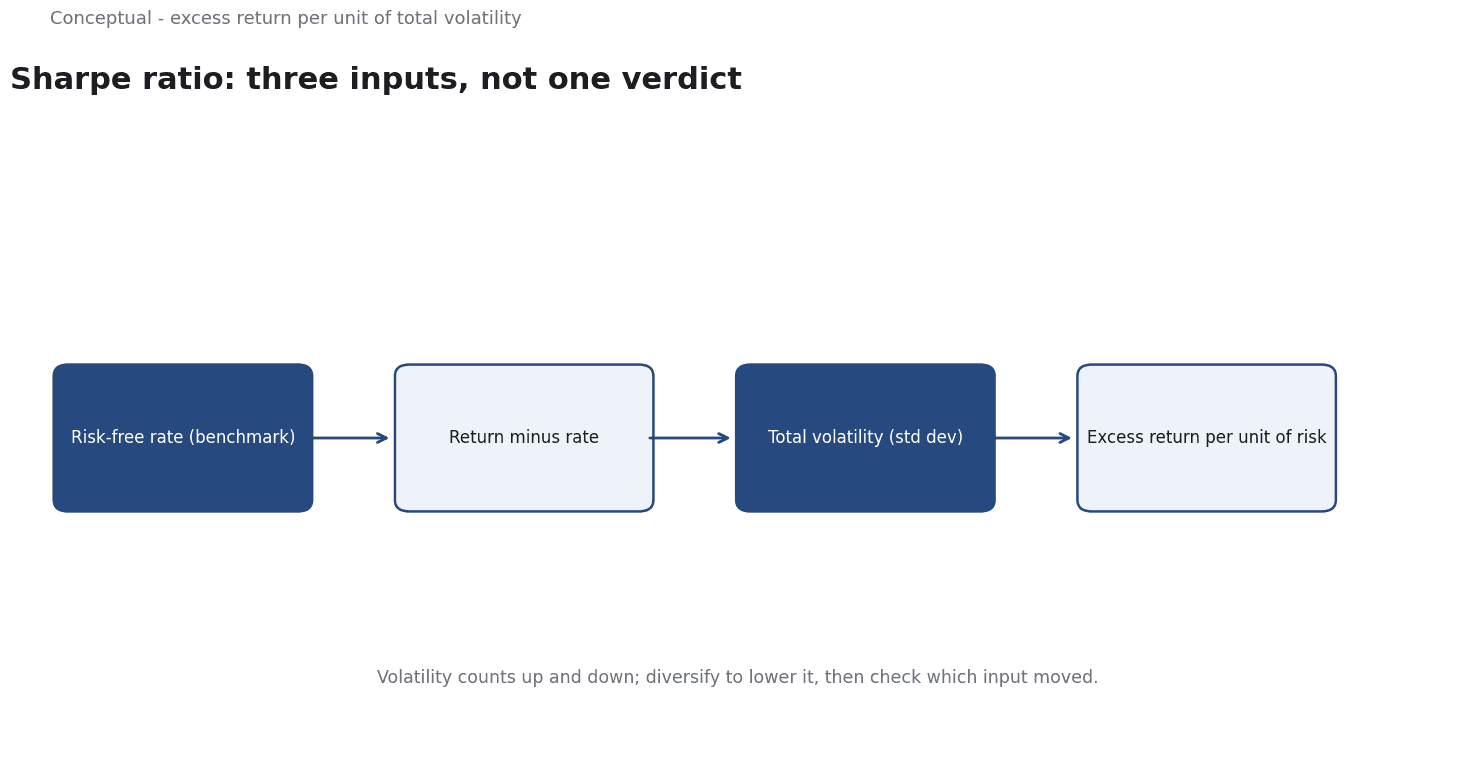
Diversification describes spreading exposure across financial instruments, industries, and categories so that the risk of any single holding has less influence on the whole. The entry distinguishes risk that is specific to an asset from risk that affects the market as a whole; combining loosely correlated assets can reduce the first while leaving the second. The practical consequence is that the mix of holdings can change the ratio's denominator without any change in expected return. Diversification is therefore one route to a higher ratio, but it is a claim about composition, not a guarantee about outcome.
The two sources connect at a point neither states directly. The ratio defines how return and volatility combine; diversification explains one way volatility can fall. Neither supplies a comparison protocol, so the decision to act on a difference in ratios is local.
A higher ratio can reflect better returns, lower volatility from diversification, or a change in the rate or measurement window.
Those causes have different implications and must be separated before a number drives a decision.
The output is a mapping from each input to the action that moves it: the benchmark sets the rate, the holdings set the volatility, and the observation window sets the estimate. That mapping is the decision instrument, because it shows which part of a ratio changed and why.
A worked example
The following is hypothetical and illustrative. A reviewer compares two funds with the same average return over one year, one concentrated in a single sector and one spread across weakly correlated sectors. Three checks decide the reading. First, was the same risk-free rate applied to both? Second, were volatility and return measured over the same window and at the same frequency? Third, does the correlation between holdings explain the difference in volatility? The review finds identical rates and windows and lower volatility in the diversified fund, producing the higher ratio. The outcome is a decision to keep the diversified mix, with a note that the ratio does not describe tail loss. The numbers are hypothetical; the verification method is the contribution.
Evidence status
| Claim | Status | Source | Verified | Recheck when |
|---|---|---|---|---|
| Sharpe ratio is excess return divided by return volatility | source-reported | Wikipedia, Sharpe ratio | 2026-11-18 | Definition revised |
| Diversification reduces asset-specific risk but not market risk | source-reported | Wikipedia, Diversification | 2026-11-18 | Entry revised |
| Compare ratios only under a common rate, horizon and frequency | inferred | Derived from the sources | 2026-11-18 | Inputs change |
The first two rows come straight from the sources: the ratio's definition and the effect of diversification on asset-specific risk. The third is inferred because neither source sets a comparison protocol. Recheck the definition when the entry is revised, the diversification row when that entry changes, and the inferred row when the rate, window, or return frequency changes.
What it cannot do
The Sharpe ratio does not measure all risk. It uses the standard deviation of returns, which counts upside volatility as though it were harmful, and it does not describe the shape of the distribution. The entry defines the ratio and the diversification entry describes how asset-specific risk falls, but neither says the ratio captures tail loss or liquidity risk. A portfolio can show a strong ratio and still suffer a large, rare loss. The measure summarises one property of returns; it is not a complete account of danger, and a reviewer should not treat it as one.
The hidden cost lies in the inputs. Excess return depends on the chosen risk-free rate, and volatility depends on the observation window and sampling frequency. Each choice is defensible in isolation and can change the ranking of two portfolios. There is also a cost in data quality: returns computed from inconsistent prices or missing periods produce a ratio that looks precise and is not. The comparison effort usually exceeds the arithmetic, which is trivial. A team that presents a ratio without its inputs has presented a conclusion without its evidence.
A ratio measured monthly against one risk-free rate is not directly comparable to one measured daily against another. A related failure is treating a higher ratio as proof of better diversification: the ratio can rise because volatility fell for reasons unrelated to the mix of assets. Because the sources define the measure but not a comparison protocol, the protocol is local and must be stated before numbers are compared. A reviewer should ask what stayed fixed between the two calculations.
The scope is the relationship between excess return and total volatility. It does not cover leverage constraints, transaction costs, taxes, or an investor's need for cash, all of which can make a high-ratio portfolio unsuitable. Diversification reduces asset-specific risk but leaves market risk, and the ratio says nothing about that residual. The method also assumes returns are described adequately by a mean and a standard deviation, an assumption the sources do not defend for every market condition. Decisions needing those considerations require a different tool.
Because market conditions and data inputs change, any ratio should be recorded with its rate, window, and frequency. A recheck condition should trigger when the inputs change or when the portfolio's holdings shift materially. Without that record, a past ratio cannot be reproduced and a comparison becomes an unverifiable claim. A review that can reconstruct the inputs can at least tell whether a change in the number came from performance or from measurement.
The counterargument that the Sharpe ratio is fair for quick comparisons is incomplete when the two ratios use different windows, rates, or return frequencies.
A decision test
- State the decision the ratio is meant to support.
- Fix a risk-free rate and document it.
- Choose an observation window and sampling frequency.
- Compute excess return and volatility from the same data.
- Compute the ratio for each option under identical inputs.
- Check whether diversification or measurement explains a difference.
- Record inputs and a recheck condition.
The Sharpe ratio is useful only when its inputs are fixed and visible. The test keeps the numerator, the denominator, and the comparison protocol separate, so a reviewer can see whether a difference came from returns, from volatility, or from the way the numbers were measured. When tail risk or cash needs dominate the decision, the ratio should be set aside. For further reading, see Cash Flow Forecasting.
References & Further Reading
- Wikipedia contributors, 2026. Sharpe ratio - Wikipedia — The definition of risk-adjusted return and its computation using excess return and standard deviation.
- Wikipedia contributors, 2026. Diversification (finance) - Wikipedia — Risk reduction through a mix of holdings.