Shrinkage Metrics that Matter
Shrinkage has several causes that one number hides. Read the metrics, a worked example, and why a smaller total can still be worse.
Shrinkage is often reported as a single percentage of sales, which hides its causes. The Wikipedia entry describes inventory loss and its categories, and the inventory entry treats stock as cash. The useful metric separates the causes so a control can be aimed at the right one.
Direct answer: Break shrinkage into recorded categories, measure each as a rate, and verify the count before treating it as loss. The sources define the categories; the measurement rule is a synthesis.
Delta: This article adds a claim-status table and a worked reconciliation, separating documented categories from the local thresholds used to act on them.
The mechanism
Three distinctions matter:
- Error versus physical loss. The shrinkage entry describes several causes. A counting mistake is not the same problem as a missing item.
- Rate versus absolute value. A falling percentage can accompany a growing cash loss if sales fall faster. The inventory entry treats stock as cash, which makes the absolute figure relevant.
- Category by location or process. A total says nothing about where the loss occurred. Breaking it down is the first step toward a control.
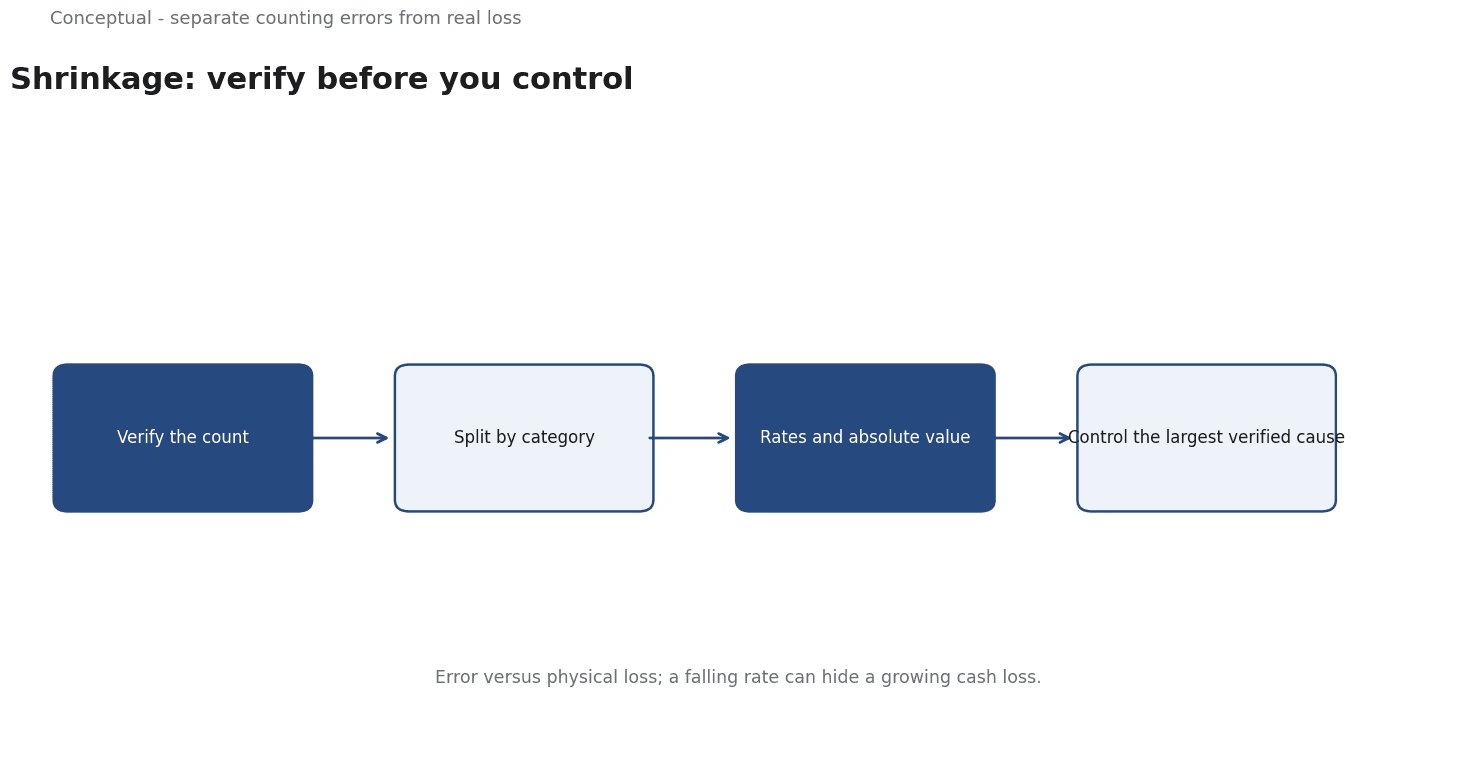
The sequence is: verify the count, split by category, compute rates and absolute values, then choose a control for the largest verified cause.
Choosing a threshold is judgement, so it is inferred; the categories are source-reported.
A worked example
Illustrative. A shop reports 4% shrinkage, down from 5% last year, but a higher cash loss.
Three checks decide. First, did sales fall enough that the lower rate represents a larger absolute loss? Second, how much of the difference is counting error, using a recount of a sample? Third, which category and location account for the largest verified loss?
The outcome is a targeted response rather than a general policy. The numbers are hypothetical; the reconciliation is the contribution.
Why the categories decide the control
A general response to shrinkage spends money on every possible cause at once. Categorising the loss makes it possible to choose a control that fits the problem. Counting errors are addressed with procedure, external theft with physical controls, and process gaps with better handoffs. A single percentage cannot tell you which of those to fund.
The order of investigation matters. Verifying the count is cheaper than installing cameras, and it prevents a control from being aimed at an accounting artefact. A sample recount that shows little error is equally useful, because it tells you the loss is real and attention should move elsewhere.
What belongs in the monthly view
A useful monthly report shows the rate, the absolute value, the category split, and the locations that deviate from the rest. It also records which recounts were performed and what they found. That combination is enough to decide whether the next action is investigation or a control, which is the decision the metric exists to support.
Evidence status
| Claim | Status | Source | Verified | Recheck when |
|---|---|---|---|---|
| Shrinkage has multiple causes | source-reported | Wikipedia, Shrinkage | 2026-11-18 | Definition revised |
| Inventory ties up cash | source-reported | Wikipedia, Inventory | 2026-11-18 | Accounting rules change |
| Verify and categorise before choosing a control | inferred | Derived from the categories | 2026-11-18 | Process changes |
Why the rate can mislead
A percentage relates loss to sales. When sales fall, the same or a larger cash loss can produce a smaller percentage. Showing both the rate and the absolute value removes the ambiguity.
Counting error is the other source of false conclusions. A difference discovered at year end may have been created at the point of counting. A sample recount is a cheap way to estimate how much of the reported difference is real before spending money on controls.
A final consideration is timing. A category that dominates one month may disappear the next, and a control chosen from a single month can address noise. Tracking each category over several periods turns an apparent cause into a verified pattern.
Why location matters
A single total averages together locations with very different problems. One store may have a counting issue, another a process gap, and a third a genuine loss. Reporting one percentage for all three produces an average that matches none of them. Breaking the figure down by location is a small change that usually changes the decision.
What it cannot do
It cannot identify a cause without investigation. It does not guarantee that a control will work. And it cannot remove the need for accurate records, which are the condition for any of these metrics to mean anything.
The counterargument that a single percentage is enough is fair for a quick view and incomplete for a decision.
A decision test
- Recount a sample.
- Split the loss by category.
- Compute rate and absolute value.
- Break down by location or process.
- Choose a control for the largest verified cause.
- Record the decision and the recheck date.
For the operational side, see Loss Prevention for Small Teams.
References & Further Reading
- Wikipedia contributors, 2026. Shrinkage (accounting) - Wikipedia — Inventory loss and its causes in retail.
- Wikipedia contributors, 2026. Inventory - Wikipedia — The role of stock in operations and accounting.