The Economics of AI: Why Intelligence Is Becoming a Commodity
The price of a unit of AI output is falling while the cost of the inputs behind it is rising fast. Read the adoption and energy data behind that split.
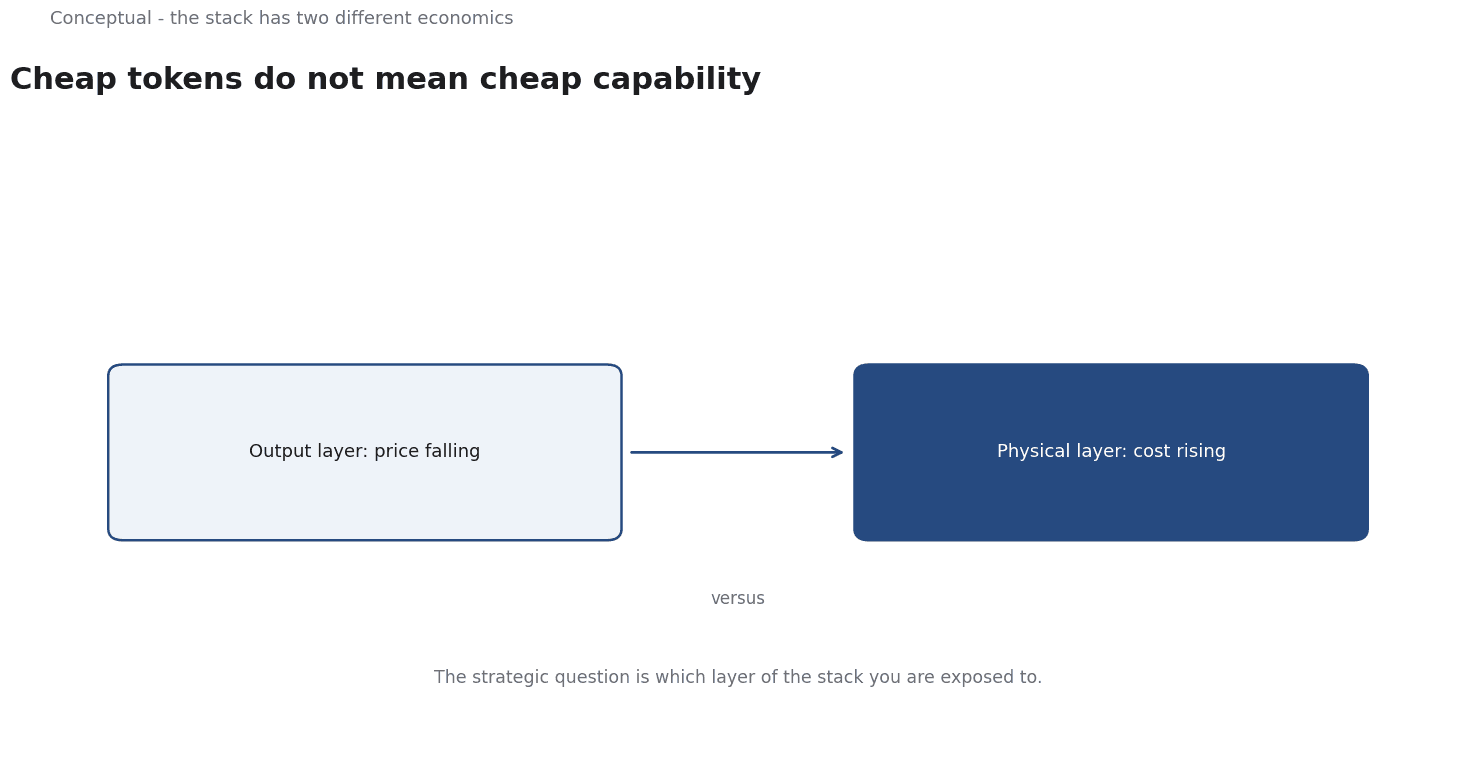
"Intelligence is becoming a commodity" is the kind of claim that is either obviously true or obviously false depending on which part of the stack you are looking at. At the layer where a business buys output — tokens, API calls, inference — the price is falling and the capability is spreading. At the layer underneath, the physical cost of running that inference is rising fast and concentrating in a handful of places. Both are happening at once, and a company that reasons about only one of them will plan badly.
Direct answer: The economics of AI are a split, not a trend. On the demand side, generative AI has spread faster than any previous general-purpose technology — nearly 40% of working-age Americans used it by late 2024, and 9% of employed people used it every workday — while measured aggregate time savings sat at about 1.4% of work hours. On the supply side, the physical inputs behind that capability are growing fast: data centres used about 1.5% of the world's electricity in 2024 and are projected to roughly double their consumption by 2030. Intelligence is getting cheaper per unit at the same time that the capital and power required to produce it are concentrating.
The strategic question is not whether AI becomes cheap, but which layer of that stack you are exposed to.
The demand side: adoption is fast, value is not yet measured
The adoption numbers are unusually well documented, because they come from survey work rather than vendor telemetry.
Brynjolfsson, Li and Raymond report "a series of nationally representative U.S. surveys of generative AI use at work and at home". As of late 2024, "nearly 40 percent of the U.S. population age 18-64 uses generative AI". Among employed respondents, "23 percent had used generative AI for work at least once in the previous week, and 9 percent used it every work day". Measured against each technology's first mass-market product launch, "work adoption of generative AI has been as fast as the personal computer (PC), and overall adoption has been faster than either PCs or the internet". They also find that generative AI and PCs show "very similar early adoption patterns by education, occupation, and other characteristics".
That last point matters more than it first appears. Adoption concentrated in the same demographic pattern as the PC tells you the diffusion mechanism is the same one — it is a general-purpose tool that arrives through work, not a specialised capability that arrives through a professional buyer. It also implies that the early customer base will look like the early PC customer base, and that the value realised will depend on the same complement of general-purpose skills.
Now the number that should temper any excitement. The same paper reports that "Between 1 and 5 percent of all work hours are currently assisted by generative AI, and respondents report time savings equivalent to 1.4 percent of total work hours." The authors draw the implication carefully: this "suggests that substantial productivity gains from generative AI are possible". Potential, not realised value. A technology used by a third of the workforce that has moved aggregate time savings by 1.4% is a technology whose economics have not yet been settled in either direction.
The interpretation worth holding is that the two numbers are not independent. If 1–5% of hours are assisted, and the tool is genuinely useful on those hours, then realised savings should be roughly that fraction times the size of the per-hour effect. A 1.4% saving against 1–5% of hours assisted implies that the average per-hour effect on assisted work is small — or that the time is being spent on assisted work that never became shorter. Both possibilities point at the same conclusion: the binding constraint is not access to the capability, it is the design of the workflow around it.
The supply side: the physical bill
The cost side is measured by the International Energy Agency, and the numbers are worth taking in slowly because they are large.
Data centres "accounted for around 1.5% of the world's electricity consumption in 2024, or 415 terawatt-hours (TWh)". The distribution is highly concentrated: "The United States accounted for the largest share of global data centre electricity consumption in 2024 (45%), followed by China (25%) and Europe (15%)." Growth has been faster than the electricity system as a whole — "Globally, data centre electricity consumption has grown by around 12% per year since 2017, more than four times faster than the rate of total electricity consumption."
The forward projection is the part that should appear in a planning document: "Electricity demand for data centres more than doubles by 2030 — data centre electricity consumption is set to more than double to around 945 TWh by 2030", and in the Base Case "rising to around 1 200 TWh by 2035". The scale of individual sites is what makes this a local political issue rather than a global rounding error: "A typical AI-focused data centre consumes as much electricity as 100 000 households, but the largest ones under construction today will consume 20 times as much", and such sites "can draw as much electricity as power-intensive factories such as aluminium smelters".
The capital commitment is equally concrete: "Global investment in data centres has nearly doubled since 2022 and amounted to half a trillion dollars in 2024."
Two implications follow, and they pull in opposite directions. On the demand side, a data centre "can be plugged into any electricity grid, in any region, at any scale", which lowers the barrier to building capability and is part of why the price of inference has been falling. On the supply side, this is a fixed-cost, geographically concentrated build-out, and it will meet grid constraints: in the United States, data centres "account for nearly half of electricity demand growth between now and 2030", and in some countries they account for "more than 20% of demand growth to 2030, presenting a wake-up call on the need to put the electricity sector on a growth footing again."
Why "commodity" is the right word, and where it stops being one
A commodity is a good defined by a common unit, traded at a price, where the buyer does not care who produced it. In that sense, model capability is heading towards commodity behaviour: it is measured in a common currency (tokens, tasks), the price per unit falls, and switching between suppliers is a configuration change rather than a re-engineering.
But the economics of a commodity are set by its cost of production, and here the cost of production is highly non-commodity: concentrated, capital-intensive, and dependent on grid capacity in specific locations. When the IEA notes that in some countries data centres will account for more than 20% of electricity demand growth, the marginal cost of a unit of inference is no longer set by silicon and software alone.
So the correct way to hold the claim is in two parts. Inference capability is becoming a commodity in its interface — portable, priced per unit, substitutable. Its production is becoming an infrastructure industry with a local footprint, where the winners will be those who secure power, land, and permits early.
There is also a macroeconomic version of the same point, which the OECD's AI Policy Observatory tracks as a measurement programme rather than a forecast. The observable quantities — adoption by firm size, sector, and country; where productivity gains appear; whether they accrue to the firm, the worker, or the complement — are what will decide whether AI behaves like a general-purpose technology (and lifts the productivity growth rate) or like a sector-specific cost shock (and redistributes margin). The IEA's projection that data centres will account for around one-tenth of global electricity demand growth to 2030 is a concrete claim about where capital is going in the meantime.
What this means for a decision you have to make
If you are deploying AI capability, the economic question is not "is intelligence cheap" but "which layer am I exposed to, and against whom".
- If you buy capability as a service, your exposure is on the price-per-unit side, which is falling. Your exposure to concentration is indirect and comes through pricing during supply tightness — so watch grid and capacity announcements in the regions your provider uses, not just your vendor's product roadmap.
- If you train or serve your own models, you are on the capital side: data centres are a half-trillion-dollar 2024 investment growing close to 12% per year in electricity terms. Power and permitting are the constraints, and they are local. Assume your unit costs are set by energy availability at your site, not by your engineering.
- If you sell AI-powered products, the commoditisation of the underlying capability compresses the margin on the capability itself. The defensible position moves up the stack — to proprietary data, to workflow integration, or to the trust and accountability around the output.
- If you are planning workforce or business-model changes, do not plan against the 34% or the 19%. Plan against the 1.4%, which is what has actually been measured in aggregate, and treat the gap between assisted hours and realised savings as the project you are actually running.
The last point is the one most often skipped. A falling price per token and a rising electricity bill can both be true, and neither settles whether your organisation gets better economics from this.
That question is answered by your own measurement, not by the trend line.
For the organisational side of the same economics, see Why AI Adoption Is Harder Than Building an AI Model and How AI Is Changing the Economics of Software Development.
A counterargument
A reasonable critic would argue that the article's tidy split is doing more work than its sources support. The OECD material is described in the piece as a measurement programme rather than a forecast, yet the claim that capability is substitutable and that switching providers is a configuration change is asserted, not measured there. Brynjolfsson, Li and Raymond's 1.4% time-saving figure comes from self-reported surveys; the article reads it as proof that workflow design is the binding constraint, when it is equally consistent with value that has not materialised. The IEA's roughly doubling of data-centre demand is a projection to 2030, and the strategic conclusion about concentration rests on that scenario. The two-layer framing is a useful lens, but the article presents as settled a split whose supporting numbers it repeatedly qualifies as provisional.
References & Further Reading
- Erik Brynjolfsson, Danielle Li, and Lindsey R. Raymond, 2024. The Rapid Adoption of Generative AI — Workforce-level adoption data and the productivity-gap evidence.
- OECD, 2026. The AI Wonk - oecd.ai — Cross-country measurement and policy data for AI adoption.
- International Energy Agency, 2025. Energy and AI: Data Centres and Electricity Demand — Primary data on how data-centre electricity demand is growing and what that implies for energy markets.