What Paid Social Actually Measures
Paid social reports exposure and attributed conversions, not causation. Read the mechanism, a worked example, and the decision the numbers can support.
Paid social dashboards are often read as a record of demand created. The social influence entry describes how exposure and interaction change behavior, while Google's attribution guidance describes how credit is assigned to touchpoints. The real problem is that a reported conversion is an attribution outcome, not a measure of influence caused.
Direct answer: Paid social measures exposure, engagement, and conversions credited under a chosen attribution model. It does not measure the counterfactual: what would have happened without the spend. The two sources define influence and credit; the limit on causation is a synthesis.
Delta: This article adds a claim-status table beyond the sources: it maps credited conversions to a budget decision, with claim status explicit.
The mechanism
The Wikipedia entry on social influence describes behavior change arising from interaction with others, through processes such as social proof and conformity. In a paid social context, an ad is a deliberately placed exposure intended to trigger such processes. The practical consequence is that the platform can count that an exposure occurred, through impressions and reach, but the behavior change itself is inferred rather than observed directly.
Google's attribution guidance defines an attribution model as a rule, or set of rules, that determines how credit for conversions is assigned to touchpoints in a conversion path. Last-click, first-click, linear, time-decay and data-driven models split credit differently. The practical consequence is that the same path yields different paid social performance figures depending on the rule selected, so the number is partly a property of the model, not only of the campaign.
Taken together, the two concepts occupy different layers. Social influence concerns whether exposure can change behavior; attribution concerns how observed conversions are divided among touchpoints. A dashboard conflates them by presenting credited conversions as if they were caused ones. The practical consequence is that a team may scale spend on a channel that is receiving credit for demand it did not create.
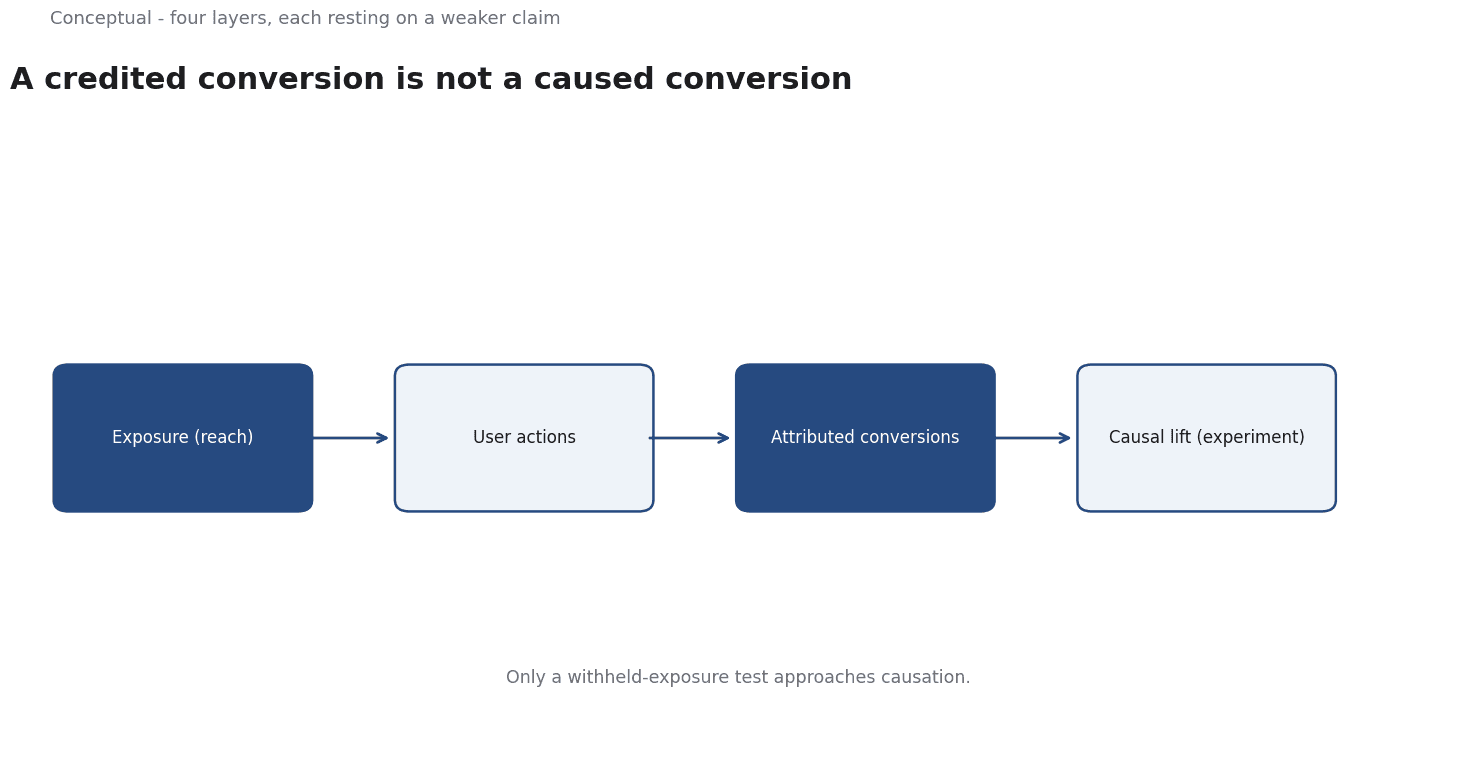
A coherent reading keeps the layers separate. Exposure metrics come from delivery data and are relatively direct. Engagement metrics are user actions. Attributed conversions depend on the attribution rule. Only an experiment that withholds exposure can approach the causal question. That ordering, from delivery to action to credited outcome to causal inference, is the mechanism, with each layer resting on weaker claims than the one before it.
A worked example
The following is hypothetical and illustrative. A brand runs paid social and sees 500 attributed conversions in a month under a last-click model, and considers doubling spend on that figure. Three checks decide. First, switch the reporting view to a linear or data-driven model and observe how much credit moves away from paid social, which tests whether the result depends on the attribution rule. Second, examine reach and frequency: if the same audience saw repeated exposures with no change in conversion rate, additional spend is unlikely to add influence. Third, consider the counterfactual by reviewing whether conversions rose during a period when the channel was paused or reduced. The outcome is a qualified decision: hold the budget increase until the credited conversions survive a model change and a pause test. The numbers are hypothetical; the sequence of checks is the contribution.
Evidence status
| Claim | Status | Source | Verified | Recheck when |
|---|---|---|---|---|
| Paid social exposure can shape behavior through social influence | source-reported | Wikipedia, Social influence | 2026-11-18 | Research on influence mechanisms changes |
| Attribution models assign conversion credit by defined rules | source-reported | Google, About attribution models | 2026-11-18 | Attribution options or defaults change |
| Credited conversions are not causal lift without a counterfactual | inferred | Derived from the sources | 2026-11-18 | Experimental evidence becomes available |
The first two rows are documented in the sources: one describes influence processes, the other defines credit rules. The third row is an inference from combining them, since neither source reports that a credited conversion equals caused demand. Recheck it if experimental results are introduced or if attribution defaults change.
What it cannot do
Attribution cannot establish causation.
It divides observed conversions among touchpoints according to a rule, but a divided conversion is not evidence that any single touchpoint was necessary. A channel can receive credit for a purchase that would have occurred anyway, and no attribution model, by itself, reveals that fact. The limit is structural: the data records what happened along a path, not what would have happened on a different path.
A hidden cost of model choice is that it quietly sets incentives. Teams optimise toward the metric their dashboard reports, so a last-click view rewards channels that close near the purchase and penalises channels that introduce it. The cost appears when budgets shift toward whichever touchpoint the chosen rule favours, even if that shift does not increase total demand. The measurement choice therefore acts as a management decision, not a neutral observation.
When several platforms each report conversions under their own attribution rules, the sum can exceed the actual number of orders. A reader who adds platform-reported conversions together will overstate performance. The failure is easy to miss because each platform figure is internally consistent; the error only appears when figures are combined.
The boundary of the measurement is the platform view. Paid social data captures exposures and conversions within its own tracking environment, which excludes offline effects, word of mouth, and conversions that fall outside tracking. Social influence often spreads through interactions the platform cannot see, so the reported figures describe a partial picture. Claims about total brand effect exceed what the data supports.
These figures need review whenever the attribution model, tracking setup, or channel mix changes. A number that was comparable last quarter may not be comparable now if the credit rule was updated or a pixel was replaced. Recording the model and the tracking configuration alongside each reported figure is the only way to keep a time series interpretable. Without that record, a trend line can reflect an instrumentation change rather than a change in the business.
The counterargument that platform-reported conversions are useful for tracking within a channel is fair for consistent, within-platform comparisons and incomplete for cross-channel budget decisions, where attribution rules and unseen influence distort the picture.
A decision test
- State which attribution model produced each reported conversion figure.
- Re-run the report under a second model and note how much credit moves.
- Separate delivery metrics from engagement metrics from attributed outcomes.
- Check reach and frequency for signs of audience saturation.
- Look for a pause or reduction period as an informal counterfactual.
- Avoid summing conversions reported by different platforms.
- Record the model and tracking setup with each figure before comparing periods.
These steps turn a credited number into a bounded decision. They do not prove causation, but they prevent the most common error: treating an attribution outcome as if it were demand created. The result is a budget choice tied to what the measurement can actually support. For further reading, see marketing dashboards without the hype.
References & Further Reading
- Wikipedia contributors, 2026. Social influence - Wikipedia — How attitudes and behaviour are shaped by others.
- Google Ads Help, 2026. About attribution models - Google Ads Help — First-party documentation of attribution models and their limits.