Causal Inference: Counterfactuals, DAGs, and Do-Calculus
What would have happened if? Causal inference answers it, but only under assumptions you can state. Learn the design logic and where the methods stop.
Correlation tells you that two things move together. It does not tell you that moving one would change the other, and in a business decision that difference is the whole question. Causal inference is the machinery for the counterfactual question — what would have happened to this outcome if we had done something else — and its most important property is that the answer is only as good as the assumptions you can state out loud.
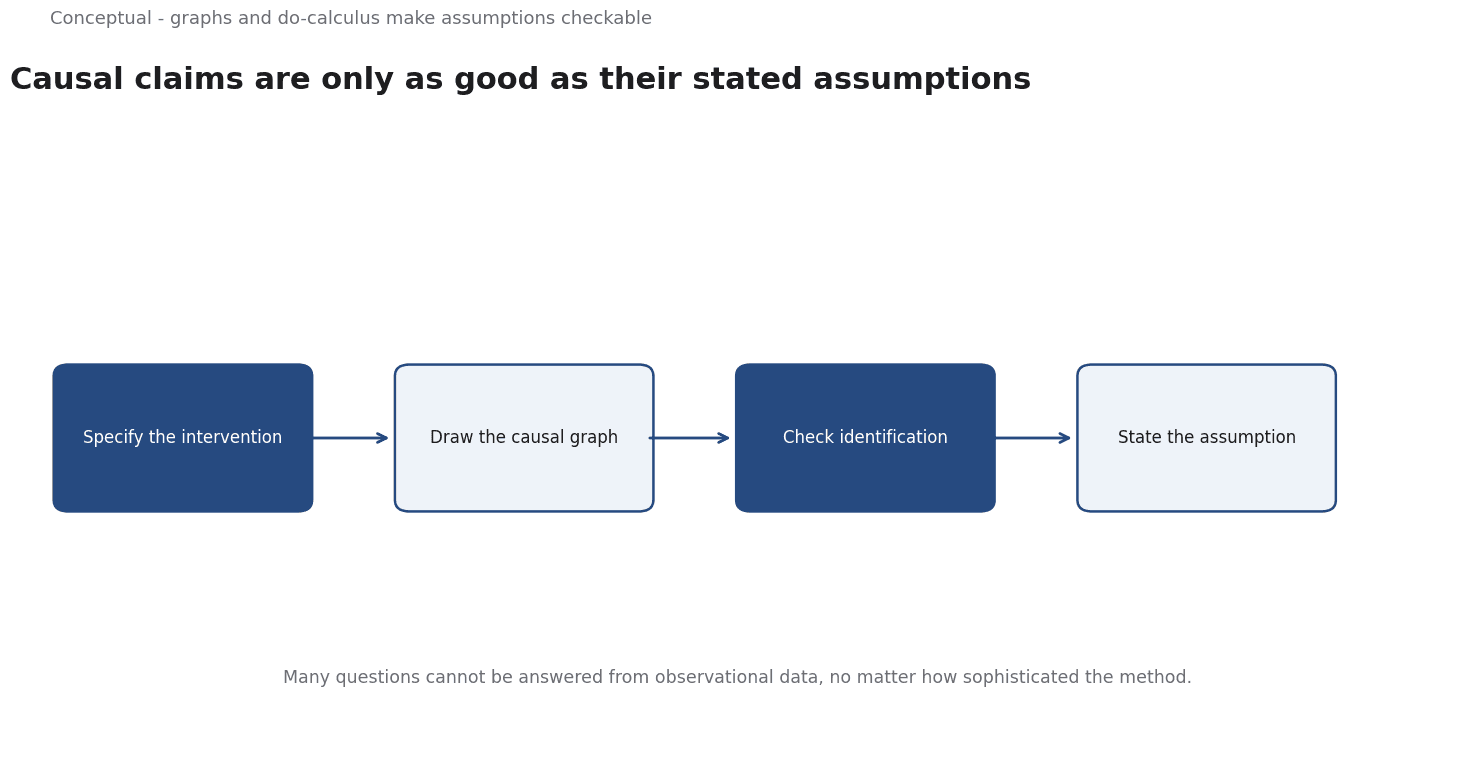
Direct answer: Causal inference asks the "what if" question by combining a causal model with an identification strategy that connects it to observable data. The design logic is to specify the intervention you want, write down the assumptions required to answer it from the data you have, and check whether those assumptions are defensible. The formal machinery — graphs, do-calculus, adjustment — is what makes those assumptions explicit and checkable. Where identification fails, no method rescues you; the honest output is "this question is not answerable with this data".
The question, and why the average is often not enough
Zhang et al. state the question in its general form: "many problems ask a question that can be formulated as a causal question: 'what would have happened if...?'" Their example is deliberately uncomfortable: "would the person have had surgery if he or she had been Black?"
They then make a distinction that changes how you should frame a question. "To address this kind of questions, calculating an average treatment effect (ATE) is often uninformative, because one would like to know how much impact a variable (such as skin color) has on a specific individual."
This is the difference between two genuinely different requests. "What is the average effect of the intervention across the population?" is a well-posed statistical question with a well-known answer shape. "What would have happened to this customer if we had offered the discount?" is a counterfactual question about a single unit, and the answer is not the average. No amount of sample size fixes this: it is a difference in estimand, not in precision.
Most business questions are the second kind, which is why "run an A/B test" is the honest answer when you can and "model it from observational data" is the compromised one.
The design logic: specify the trial you wish you had run
Hernán and Robins' framing is the most useful available, because it turns causal inference into a design problem rather than a statistical trick. Their approach — target trial emulation — asks you to specify the hypothetical randomised trial you would have run, then to construct from observational data the closest analogue of it.
The specification has parts you already know from randomised trials: eligibility criteria, treatment assignment strategies, assignment date, follow-up start, outcome, causal contrast, and analysis plan. The contribution is the discipline of writing them down before you look at the data, because the specification forces you to confront the assumptions that an observational analysis otherwise hides.
The value of the exercise is that it exposes the two failure modes that sink observational causal claims:
- Confounding. The treatment and the outcome share a common cause, so the observed association mixes the treatment's effect with the cause's effect.
- Selection and time. Who is observed, and when, is rarely random, and the treatment changes who survives to be observed.
A target trial specification makes both visible at the point where you can still do something about them: by choosing eligibility criteria that make treatment groups comparable, by using time-zero and follow-up definitions that avoid immortal-time bias, and by stating explicitly which confounder adjustment you are relying on.
The graph is where the assumptions live
Peters, Janzing and Schölkopf's textbook is the standard reference for the formal treatment, and its structure is what matters here. The graph is the object on which the analysis happens:
- Variables are nodes; causal relationships are directed edges, forming a DAG.
- Confounders are common causes; mediators lie on the path from cause to effect; colliders are common effects.
- The graph determines which adjustment sets are valid, and it is what makes the do-calculus — the rules for answering "what if I intervened on X?" — possible.
The single most valuable property of the graph is that it turns a vague worry ("there might be confounding") into a specific, checkable, and finite problem: which variables must I adjust for, and which must I not adjust for? Adjusting for a collider or a mediator introduces bias rather than removing it, and no amount of statistical technique protects you from a wrong graph.
This is also where the "do" notation earns its keep. Intervening on a variable is not the same as observing it, and the graph makes the difference operationally explicit. In practice, the important question is rarely the calculus; it is whether the graph you assumed is defensible, and whether the question is identified given that graph.
Where identification fails
The honest boundary of causal inference is that many questions cannot be answered from observational data, no matter how sophisticated the method.
Fan et al. make the point in the context of a specific method, and it generalises: "a key challenge to drawing such inferences in observational settings is the possible existence of unmeasured confounding, which may invalidate most commonly used methods that assume no hidden confounding bias."
Read that as a design constraint rather than a method complaint. If a confounder is unmeasured, then methods that assume no hidden confounding bias are simply invalid for your data. What remains is not a weaker version of the same estimate — it is a different kind of claim: an assumption-dependent sensitivity analysis, a partially identified bound, or an honest statement that the effect is not identified.
The practical implication for planning is important. If a decision hinges on an effect that your data cannot identify, the options are to collect the data that would (a randomised trial, an instrument, a natural experiment), to narrow the question so it becomes identified, or to make the decision under explicit uncertainty.
The difference between a causal claim and a leakage-free model
Two kinds of bias get confused constantly, and the confusion is expensive in both directions.
Leakage is a modelling error: information that would not be available at prediction time was used in building the model. The fix is procedural — split first, fit nothing on the future — and it is described exactly that way in scikit-learn's guidance: "Data leakage occurs when information that would not be available at prediction time is used when building the model."
Confounding is a design problem about the world: the treatment and the outcome share causes, and no amount of clever modelling removes that from the data.
The practical difference: leakage is an engineering bug you can find by auditing the pipeline, and it is always fixable. Confounding may be unfixable with the data you have. Treating a confounding problem as if it were a leakage problem leads you to add features and call it progress; treating a leakage problem as confounding leads you to invoke assumptions instead of fixing the split.
A checklist for a causal claim before it ships
- State the estimand in one sentence, including the population, the intervention, the comparator, and the time horizon. If it takes a paragraph, it is not yet specified.
- Write the target trial first. Eligibility, assignment, time zero, outcome, contrast. Then say how your observational data differs from it — every difference is an assumption you must defend.
- Draw the DAG, even roughly, and mark the confounders you will adjust for and the ones you will deliberately leave alone. If the graph is impossible, the question is probably not identifiable.
- Check for immortal time and selection, the two biases that target trial specification is designed to surface.
- State the identifying assumption explicitly and say what happens to the conclusion if it is false. A sensitivity analysis is the minimum honest accompaniment.
- Prefer the randomised design when the decision is important enough. Causal inference from observational data is the fallback, not the first choice, and the target trial specification tells you what a randomised version would have to look like.
- Do not report an average effect for a question about an individual. If that is what is being asked, say what the method can and cannot deliver.
For the evaluation-design counterpart — how to make a split that supports a causal or predictive claim — see Model Monitoring and Recommender Systems.
A counterargument
There is a practical objection to this rigorous framing: its honesty can be paralysing. The article is right that a DAG makes assumptions explicit, but the graph is drawn by the analyst, and no test inside the framework validates it - Hernan and Robins' target trial emulation is still an observational approximation whose credibility rests on the very comparability assumptions it asks you to write down. Fan et al.'s warning about unmeasured confounding leads to the correct conclusion that the effect may be unidentified, yet the alternative the article offers - bounds, sensitivity analysis, "not answerable with this data" - gives a decision-maker no actionable magnitude. When a business must choose now, a coarse estimate with stated assumptions may dominate a principled refusal.
The discipline of stating assumptions is a real contribution, but treating identification failure as a hard stop conflates what the data can prove with what a decision requires.
References & Further Reading
- Miguel A. Hernán and James M. Robins, 2020. Causal Inference: What If — Hernan and Robins on target trial emulation, g-methods, and the design of observational studies.
- Jonas Peters, Janzing, and Schölkopf, 2017. Elements of Causal Inference — A textbook treatment of graphical causal models, identification, and the do-calculus.
- Yingying Fan et al., 2022. Proximal Causal Inference for Marginal Counterfactual Survival Curves — Why unmeasured confounding invalidates methods that assume no hidden confounding bias.
- Kun Zhang et al., 2023. Optimal Transport for Counterfactual Estimation: A Method for Causal Inference — Why an average treatment effect can be uninformative when the question is about an individual.