Commodity Markets: Oil, Gold, and Price Discovery
Commodity prices come from physical constraints and storage economics. Read what price discovery means and why these markets resist simple models.
Commodities are often discussed as if they were ordinary assets whose prices reflect expectations about future value. They are not. A barrel of oil and an ounce of gold are interchangeable with other barrels and ounces, they cost money to store, and their supply cannot be expanded on demand. Those properties create a different price mechanism.
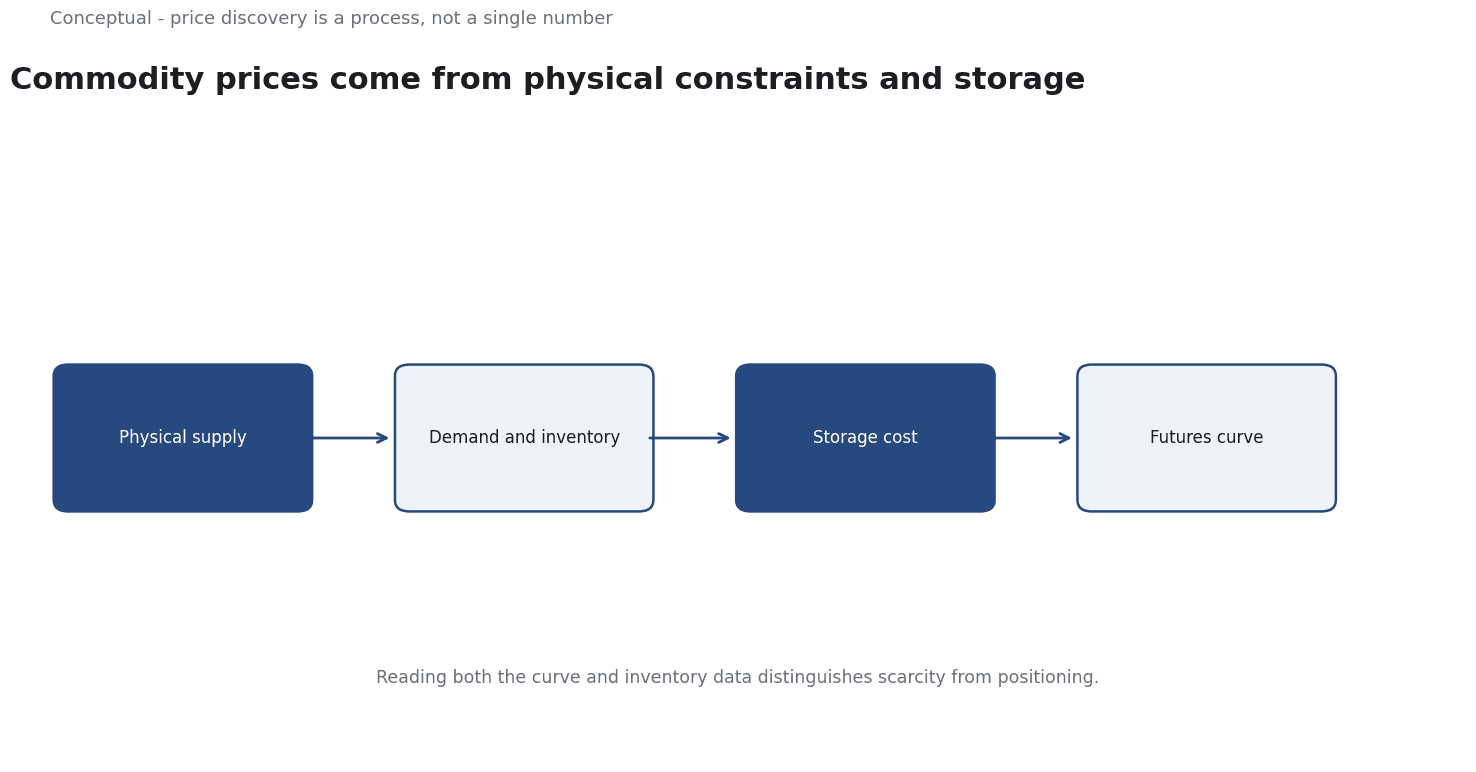
Direct answer: Commodity prices emerge from the interaction of physical supply, demand, inventory, and storage costs, with futures markets adding a forward-looking layer that can amplify or buffer the underlying conditions. The US Energy Information Administration is the primary source for petroleum data, publishing statistics and analysis on crude oil and petroleum products. The essential distinction is that a commodity is a consumed or stored physical good, not a claim on a business's future cash flows, so the tools used to value equities do not transfer directly.
What makes a commodity different
Three properties separate commodities from other traded assets.
Fungibility. One unit is interchangeable with another of the same grade, so there is no basis for preferring a particular producer's output beyond quality and location. This is why price is a market-wide number rather than a company-specific judgement.
Storage and carry. Holding a physical commodity costs money — warehousing, insurance, financing, and spoilage for some goods. The cost of carry creates a relationship between today's price and tomorrow's futures price that has no equivalent for a share of stock, which can be held almost for free.
Supply inelasticity in the short run. Producing more oil, gold, or wheat takes time, capital, or a harvest cycle. When demand shifts suddenly, the adjustment happens mostly through price and inventory rather than through immediate changes in output.
These properties explain why commodity markets can move violently without any change in the long-term story. A temporary storage constraint or a supply interruption can dominate the price for months.
Price discovery is a process, not a number
Price discovery is how the market arrives at a price that clears supply and demand, and in commodities it involves several linked mechanisms.
Spot markets clear physical supply for immediate delivery. Prices here reflect current conditions most directly, including local bottlenecks and transport constraints.
Futures markets let producers and consumers lock in prices for future delivery. They serve a hedging function — a producer wants certainty about the price of next year's output, and an airline wants certainty about fuel — and speculation supplies the counterparty and liquidity. The resulting curve reflects expectations about future supply, demand, and storage costs.
Inventories are the buffer. When supply exceeds demand, stocks rise and prices weaken; when demand exceeds supply, stocks fall and prices strengthen. Inventory data is therefore a central input, which is why the EIA publishes it alongside prices and production figures.
The term structure — the pattern of prices across delivery months — encodes the market's view of scarcity. When near-term prices are higher than later ones, the market is tight now and expects relief; when later prices are higher, storage is economical and the market expects scarcity later. This pattern is information, not a curiosity.
The practical lesson is that a single headline price is a thin summary.
Gold is a different kind of commodity
Gold shares the physical properties, and its demand has a large monetary and psychological component. It is bought as jewellery, as an industrial input, and as a store of value, and the latter demand responds to real interest rates, currency concerns, andrisk-averse sentiment rather than to a consumption need.
This makes gold's price less tied to a specific supply-demand balance than oil's, and more sensitive to expectations about the monetary system. It does not make gold mysterious; it means the relevant demand function is different, and a model built for a consumed commodity will misread it.
For a portfolio, the distinction matters: gold does not produce cash flow, so its return comes entirely from price changes, and its role is usually as a diversifier rather than an income asset. The OCC's general warning about derivatives applies if options are used: "Options involve risk and are not suitable for all investors", and the official risk document exists for a reason.
A worked example of a backwardation signal
The term structure turns a vague idea about scarcity into an observable number. Suppose crude oil for immediate delivery trades at 80 a barrel, while a contract for delivery in twelve months trades at 76. The market is in backwardation: near-term prices exceed later ones.
The usual reading is that supply is tight now and the market expects relief. Three mechanisms can produce that shape:
- Low inventories. When stocks are scarce, buyers pay a premium for immediate access, and the premium disappears when supply is expected to recover.
- Storage economics. If holding oil is expensive or risky, the future price must be lower than the spot price by roughly the cost of carry, or nobody will store it.
- Convenience yield. Holding a physical barrel has value when supply is uncertain, because it protects a refinery from interruption. That value is higher when stocks are low, and it pushes the spot price above the future price.
Now invert the example: spot at 76 and twelve-month at 82. The market is in contango, consistent with ample storage and an expectation of tighter conditions later. A producer that expects to sell in a year can lock in the higher price; a consumer that needs oil now benefits from the lower spot.
The practical point is that the shape of the curve is a claim about the physical system, and the EIA's inventory data is the way to check it. A trader who reads backwardation as purely speculative has ignored the storage constraint; one who reads contango as complacency has ignored the cost of carry. Neither conclusion follows from the price alone.
For the energy system behind the oil market, see How Energy Markets Actually Work.
Where simple models fail
Three regularities make commodity prices hard to model with the tools used for equities.
Mean reversion is conditional. A price spike can persist while a supply constraint lasts, and "too high" is not a reason to short something you cannot store or produce. A model that assumes prices return quickly to an average will be wrong for as long as the physical constraint holds.
Volatility clusters. Supply disruptions and demand shocks arrive in bursts, so volatility is not constant, and a model calibrated on a calm period understates the risk of a turbulent one.
The financial layer feeds back. Futures positions, margin calls, and index rebalancing can amplify a physical move. A price change that begins in the physical market can be intensified by positioning, and a change that begins in positioning can force physical adjustments.
The EIA's data is the right anchor because it measures the physical system; exchange data measures the financial layer.
Reading both is how a claim about scarcity is distinguished from a claim about positioning.
A practical sequence
- Start with the physical balance — production, consumption, and inventories from a primary source such as the EIA.
- Read the forward curve, not just the spot price, and say what the shape implies about expected scarcity.
- Separate a supply shock from a demand shock before drawing a conclusion about duration.
- Check the storage economics where the good is storable, because carry costs shape the curve.
- Treat a price forecast as conditional on the physical assumptions, and state those assumptions explicitly.
- Do not apply equity valuation tools. A commodity does not generate earnings, and a company's free cash flow model says nothing about the price of its output.
- Respect the risk disclosure on any derivative used for exposure, including the OCC's guidance on standardised options.
What the discipline requires
A commodity view that is defensible has to be explicit about three things that equity analysis usually leaves implicit.
First, the time horizon of the physical constraint. A supply interruption that lasts weeks and one that lasts years produce very different price paths, and the same headline price can be a buying opportunity in one case and a new normal in the other. The EIA's production and inventory data is the way to distinguish them, because it measures the physical system rather than the reaction to it.
Second, the role of storage. A storable commodity has a price floor and ceiling shaped by the cost of carry and the convenience yield, while a non-storable one — electricity, for example — can see prices that disconnect completely from fundamentals for hours at a time. Applying the same model to both is a category error.
Third, the source of the view. A prediction based on a physical balance is a different claim from one based on positioning or sentiment, and both can be right over different horizons. Writing down which one you are using is the only way to learn from the outcome.
For the energy system that drives oil markets, see Energy Markets; for the interest-rate environment that moves gold, see Central Banking.
A counterargument
A fair objection is that the article overstates how cleanly the physical balance anchors the price. It tells readers to start with EIA production and inventory data and treat the forward curve as "a claim about the physical system", yet concedes that futures positions, margin calls, and index rebalancing feed back into physical moves. If positioning can initiate a price change as readily as respond to one, EIA data is not an unambiguous anchor but one input among several. Its own references point elsewhere: FRED supplies macro indicators, and the OCC's options warning acknowledges a financial layer beyond inventory data.
For gold, where demand is monetary and psychological, the prescribed physical-balance discipline imposes a false precision on a price that is largely a claim about real rates and currency confidence.
References & Further Reading
- U.S. Energy Information Administration, 2026. Electricity data — Primary electricity generation and price data.
- Federal Reserve Bank of St. Louis, 2026. FRED economic data — The primary time-series database used for macro indicators.
- U.S. Securities and Exchange Commission (Investor.gov), 2026. Introduction to Investing — Primary regulator guidance on market mechanics and investor protection.