Fixed Income Markets: Bonds, Yields, and Duration Risk
Bond prices move inversely to yields because the coupon is fixed. Read the mechanism, a priced worked example, and the three risks that are often conflated.
A bond looks simple: lend money, receive interest, get the principal back. The subtlety is that the interest payments are usually fixed in nominal terms while the market's required return changes every day. That mismatch is the entire source of bond price risk, and it is quantifiable.
Direct answer: A bond is a debt obligation — Investor.gov describes it as "like an IOU", where the buyer lends money and the issuer makes "a legal commitment to pay interest on the principal and, in most cases, to return the principal when the bond comes due". Because "with a fixed coupon rate, the coupon payments stay the same regardless of changes in market interest rates", the price must adjust when yields move: price and yield move in opposite directions. Duration measures how much.
The mechanism
Three quantities define a plain bond.
Face value is the amount repaid at maturity. Coupon is the periodic interest payment, set as a rate on the face value. Maturity is the date the principal is due.
The bond's price is the present value of all future cash flows — coupons plus principal — discounted at the market's required yield. This is not an accounting convention; it is the arithmetic of why a bond trading below par offers a yield above its coupon.
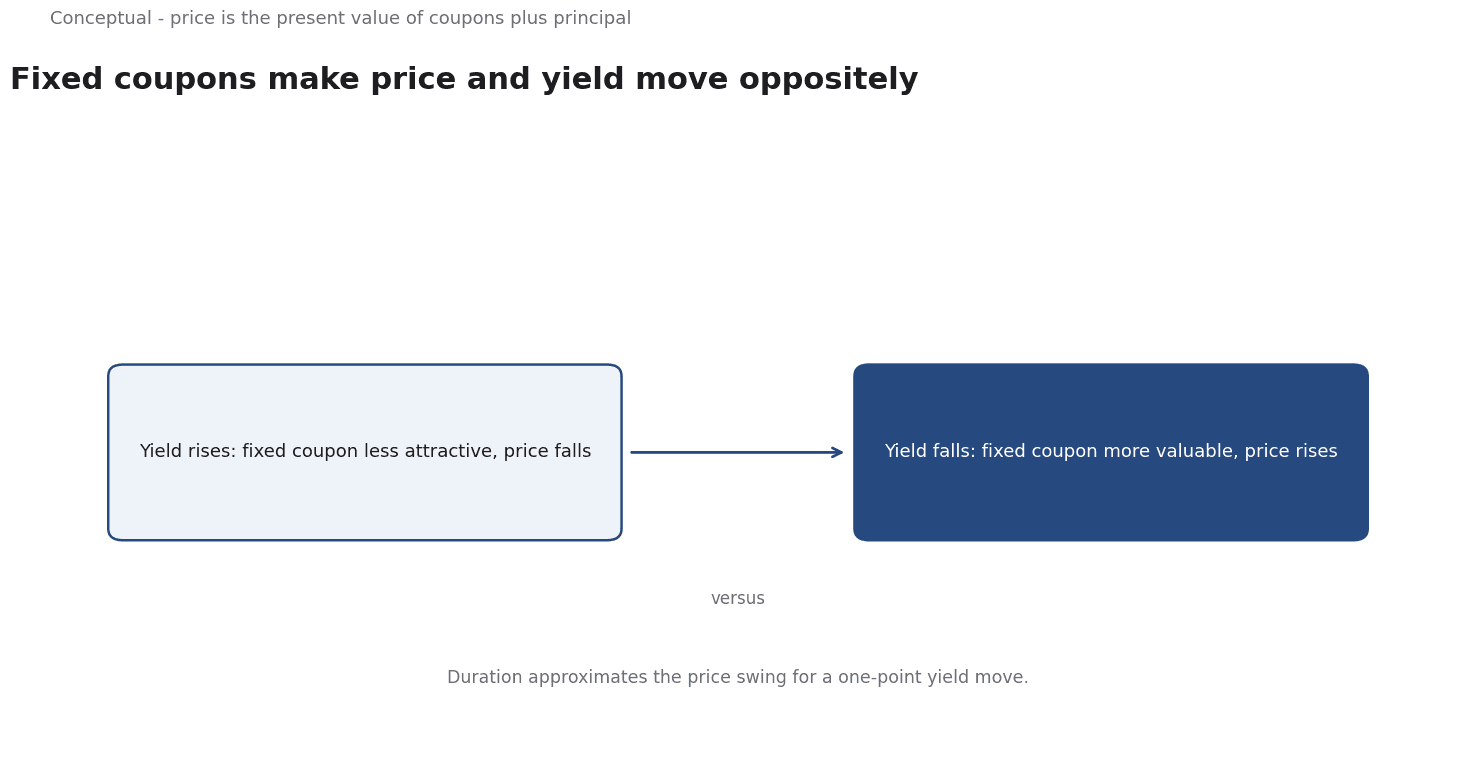
When market yields rise, a fixed coupon becomes less attractive, so the price must fall to bring the effective yield in line.
When yields fall, the fixed coupon becomes more valuable and the price rises. The mechanism is mathematical, not sentimental.
Investor.gov draws a useful distinction from equities: a bondholder does not own the company and "will receive only the interest and principal on the bond, no matter how profitable the company becomes". In bankruptcy, bond investors "have priority over shareholders in claims on the company's assets". That is the trade-off: limited upside, but a prior claim.
A worked example of price and duration
The following calculation uses hypothetical numbers to show the mechanism. Consider a bond with face value 1,000, a 5% annual coupon paid once a year, and five years to maturity. The annual coupon is therefore 50.
Case 1 — market yield equals the coupon (5%). The bond trades at par, 1,000, because the discounted cash flows exactly match the coupon rate.
Case 2 — yield rises to 6%. Discounting the five coupons and the principal at 6%:
- Present value of coupons: 50 × [1 − (1.06)^−5] / 0.06 ≈ 50 × 4.212 ≈ 210.6
- Present value of principal: 1,000 / (1.06)^5 ≈ 747.3
- Price ≈ 957.9 — a fall of about 4.2%.
Case 3 — yield falls to 4%. Discounting at 4%:
- Present value of coupons: 50 × [1 − (1.04)^−5] / 0.04 ≈ 50 × 4.452 ≈ 222.6
- Present value of principal: 1,000 / (1.04)^5 ≈ 821.9
- Price ≈ 1,044.5 — a rise of about 4.5%.
The asymmetry is real: the price rise from a 1% yield fall is slightly larger than the fall from a 1% yield rise. That curvature is convexity, and it matters more for long-duration bonds.
Duration summarises the sensitivity. For this bond, modified duration is roughly 4.3 years, which gives the rule of thumb: a 1 percentage-point yield move changes the price by about 4.3%. The exact calculation above produced 4.2% for a rise — close enough to show that duration is a linear approximation of a curved relationship.
The practical consequence: a fund holding bonds with seven-year duration will see roughly a 7% price swing for a 1% yield move, before any income is counted.
Three risks that get conflated
Interest-rate risk is the price sensitivity just described. It applies even to a government bond with no default risk.
Credit risk is the chance the issuer fails to pay. Investor.gov's point about priority in bankruptcy is the relevant boundary: bondholders rank ahead of shareholders but behind other claimants, and recovery can be far below face value. A high yield may be compensation for credit risk, not a free lunch.
Inflation risk is the erosion of purchasing power. A nominal coupon of 5% is not a 5% real return if inflation is higher. This is why real-return instruments and inflation-linked bonds exist, and why a nominal yield alone is an incomplete measure of attractiveness.
Liquidity is a fourth, quieter risk: some bonds trade rarely, so the quoted price may not be achievable in size. A valuation model does not guarantee an executable price.
Where the data comes from
Yield levels and the shape of the yield curve are observable. FRED, the Federal Reserve Bank of St. Louis database, publishes dated series for Treasury yields and many other economic variables, with release histories that let a reader check what was known at a given date. That discipline matters because a yield cited without a date and a series identifier is not reproducible.
The yield curve — yields across maturities — carries information about expectations and term premia, but it is not a forecast by itself. An inverted curve has preceded recessions, which is an empirical regularity, not a causal law; treating it as a trigger for a specific trade overstates what the data supports.
What the model leaves out
Three limitations should temper confidence in the arithmetic.
The discount rate is not directly observable. The yield to maturity is a model input inferred from the price, and it assumes coupons are reinvested at the same rate — which may not happen.
Credit spreads are not constant. The worked example discounted every cash flow at one rate. A corporate bond's cash flows carry default risk that varies with the issuer and the cycle, so a single yield compresses several risks into one number.
Convexity and optionality matter. Callable bonds can be redeemed early, which caps the price rise when yields fall. For such bonds, duration computed on a plain-vanilla assumption misstates the risk.
A decision test
- Separate the three risks — rate, credit, and inflation — and ask which one you are being paid to take.
- Check the duration of any fixed-income holding and ask what a 1% yield move would do to its value.
- Verify the coupon type — fixed or floating — because it determines where the price risk sits.
- Use dated yield data from a primary source such as FRED rather than an undated quote.
- Distinguish government from credit risk and look at the issuer's ability to pay, not just the yield on offer.
- Match maturity to the liability the portfolio is meant to fund; otherwise a "safe" bond can still be the wrong instrument.
For the broader market context, see Central Banking; for portfolio construction, see Personal Finance for Professionals.
A counterargument
A reasonable critic could argue that the worked example's clean arithmetic does more to persuade than the model can deliver in practice. The article's own "what the model leaves out" section concedes that the discount rate is inferred from price rather than observed, that credit spreads vary with the issuer and the cycle, and that callable bonds cap the price rise - yet the central "price and yield move in opposite directions" narrative is built on a single flat rate. The article also names liquidity as a fourth risk, admitting the quoted price may not be achievable in size, which undercuts the precision of the 957.9 and 1,044.5 figures for a real holder.
None of this breaks the mechanism Investor.gov describes; it means the linear, single-rate story is a teaching device that can mislead if read as a valuation guarantee.
References & Further Reading
- FINRA, 2026. Introduction to Investing (SEC Investor.gov) — Regulator explanation of market mechanics, bonds, and investor protection.
- U.S. Securities and Exchange Commission (Investor.gov), 2026. Introduction to Investing — Primary regulator guidance on market mechanics and investor protection.
- Federal Reserve Bank of St. Louis, 2026. FRED economic data — The primary time-series database used for macro indicators.