Personal Finance for Professionals: Managing Income, Saving, and Investing
For a professional with a steady income, the decisive variables are the savings rate, time horizon, and costs. Read the arithmetic — and what a projection cannot promise.
Personal finance advice aimed at professionals often starts with products. A more useful starting point is the structure of the problem: a steady income, a long horizon, and a set of competing claims on each pound or dollar earned. The decisive variables are how much you save, how long you leave it invested, and how much the arrangement costs — not which fund is fashionable this year.
Direct answer: For a salaried professional, the core mechanism is compound growth applied to a consistent savings rate, with diversification to avoid depending on a single asset. Investor.gov notes that "some experts consider a 7–10% annual rate of return as a useful estimate for long-term diversified investments in US stocks, based on historic averages" — and immediately adds that "all investments involve risk" and that investing "doesn't have a set rate of return". That is the right boundary: a planning assumption, not a promise.
Who this is for
This applies to someone with a predictable income, no immediate liquidity crisis, and a horizon measured in decades. It does not apply to someone facing high-interest debt, unstable income, or a near-term obligation that cannot be deferred. For those cases the sequence changes: eliminating expensive debt usually comes before investing, because a guaranteed 20% saving beats a uncertain 7% return.
The distinction matters because generic advice assumes the reader has the same constraints. A junior professional with no emergency fund and a senior professional with a mortgage face different first decisions, even if the long-term principles are shared.
The mechanism
Three forces drive the outcome.
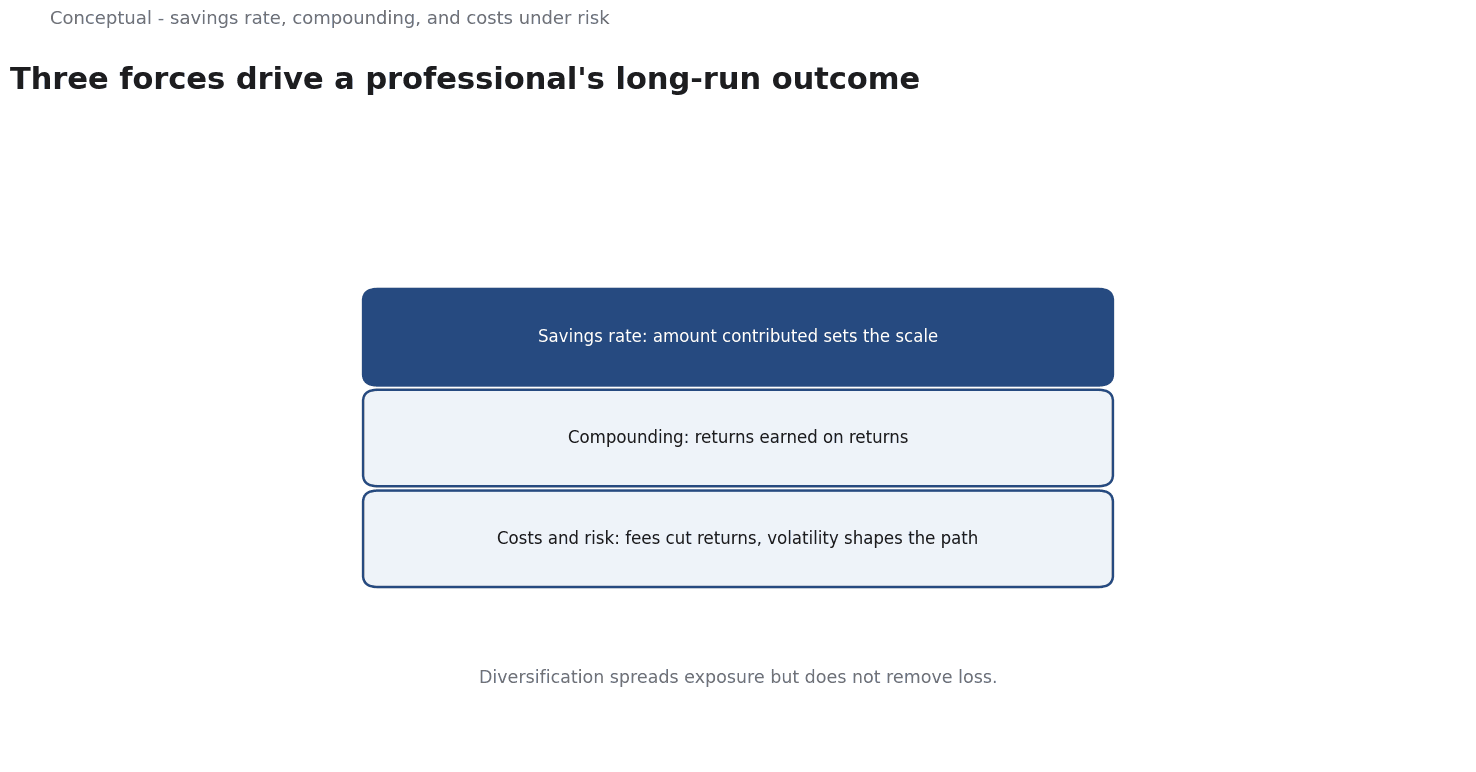
Savings rate. The amount contributed each period sets the scale. This is the variable most under a reader's control and the one that matters most in the early years.
Compounding. Investor.gov defines compound growth as earning "a return on money you invest as well as on the return your invested money earns". The effect is nonlinear in time, which is why starting earlier can matter more than contributing more later.
Costs and risk. Fees reduce the return that actually reaches the investor, and volatility means the path will not follow the average. Diversification — spreading exposure so that one failure does not dominate — addresses the second, but it does not remove the possibility of loss.
Investor.gov also distinguishes the two sources of return: an increase in an asset's value, or "interest or dividend payments". Bonds, as discussed in Fixed Income Markets, produce contractual payments but carry price risk when rates move.
A worked example of a projection
The following calculation is illustrative, uses a hypothetical reader, and applies the 7% figure cited by Investor.gov as a historical estimate, not a forecast.
Suppose a professional saves 10,000 a year at the end of each year for 30 years, earning a constant 7% annually. The future value of a series of end-of-year contributions is:
FV = C × [(1 + r)^n − 1] / r
With C = 10,000, r = 0.07, n = 30:
- (1.07)^30 ≈ 7.612
- FV ≈ 10,000 × (7.612 − 1) / 0.07 ≈ 10,000 × 94.46 ≈ 944,600
Total contributions were 300,000; the projected growth is about 645,000.
That is the arithmetic of compounding, and it explains why the savings rate and the time horizon dominate the conversation.
Now stress the assumption. At 5% the same contributions produce roughly 664,000; at 9%, about 1.36 million. The spread between those numbers is larger than the entire contributed capital, which is the real lesson: a long-horizon projection is extremely sensitive to a rate nobody can know in advance.
Three cautions make the example honest:
- The return is not a sequence. A constant 7% never occurs. A bad decade early in the accumulation phase can leave a portfolio below the smooth projection even if the long-run average is 7%.
- Inflation is not included. The projected figure is nominal. A real-return calculation must subtract inflation, and the appropriate discount rate for a future obligation depends on when it is due.
- Fees compound too. An annual fee of 1% applied over 30 years removes a substantial fraction of the ending balance. The fee is certain; the offsetting return is not.
Building the sequence
A defensible order of operations for the audience defined above:
- Cover near-term obligations and an emergency reserve before taking investment risk with money that may be needed soon.
- Eliminate high-cost debt, which is a guaranteed return equal to the interest avoided.
- Automate contributions so the savings rate does not depend on monthly willpower.
- Diversify broadly rather than selecting individual securities without a specific edge.
- Match the asset mix to the horizon — money needed in two years should not be exposed to the same risk as money needed in thirty.
- Minimise costs and turnover, since both reduce the compounding base with certainty.
- Review on a schedule, not in reaction to headlines.
Each step follows from the arithmetic, not from a product recommendation.
The trap that follows a raise
A professional's income usually rises faster than their expenses — unless the expenses rise to match.
The arithmetic is unforgiving. A reader who saves 10% of a 60,000 income contributes 6,000 a year. After a raise to 90,000, keeping the same 10% rate yields 9,000; keeping the same absolute spending of 54,000 yields 36,000 saved, six times the original contribution. The difference over 30 years is not marginal — it is the difference between a comfortable portfolio and a much larger one.
The practical response is to decide the savings rate before the raise arrives: commit a fixed fraction of each increase to savings, so that the improvement in income becomes an improvement in the portfolio rather than in the standard of living. This is a decision rule, not a product choice, and it is why the savings rate deserves more attention than fund selection.
What the projection cannot tell you
Sequence-of-returns risk. Two portfolios with the same average return can end at different values if the good years and bad years arrive in a different order, especially once withdrawals begin. This is why a projection based on a constant rate is a teaching device, not a plan.
Behaviour is part of the system. A portfolio that is optimal on paper but abandoned after a drawdown delivers the investor's actual result, not the modelled one. A simpler allocation that the reader can hold through a decline is often the better choice.
Tax and jurisdiction matter. Investor.gov is a US source, and the treatment of accounts, dividends, and capital gains varies by country. The principles are general; the implementation is not. A reader outside the US needs local rules before choosing a specific account type.
Past averages are weak evidence. The 7–10% range is described as an estimate based on historic averages for US stocks. It is not a guarantee, and the source explicitly says returns are not set. Using it as a planning input is reasonable; using it as an expectation is not.
A decision test
- Define the goal and its date before choosing an instrument.
- Calculate the required savings rate from the target and horizon, not from a product's advertised return.
- State the return assumption explicitly and test at least two alternatives.
- Subtract fees and inflation to see what the projection means in purchasing power.
- Check that short-term money is not exposed to long-term risk.
- Confirm the local tax treatment before selecting an account.
- Choose a portfolio you can keep through a bad year.
For the fixed-income component, see Fixed Income Markets; for the behavioural side, see Behavioral Finance.
A counterargument
The projection's own stress test is the strongest objection to leaning on it. The article shows 5% and 9% producing roughly 664,000 and 1.36 million against the 7% headline of 944,600 - a spread larger than the contributed capital - and Investor.gov says returns are not set.
The arithmetic is a teaching device whose central input is unknowable in advance.
A critic could argue this weakens the 'savings rate and horizon dominate' claim: those variables are controllable, but the result is swung most by the one the reader cannot know. The early step that 'a guaranteed 20% saving beats an uncertain 7% return' also compares a debt rate to a risky estimate, and the article's cautions on tax and sequence risk show how much the clean sequence leaves outside it.
References & Further Reading
- U.S. Securities and Exchange Commission (Investor.gov), 2026. Introduction to Investing — Primary regulator guidance on market mechanics and investor protection.
- FINRA, 2026. Introduction to Investing (SEC Investor.gov) — Regulator explanation of market mechanics, bonds, and investor protection.
- Options Industry Council, 2026. The Options Industry Council (OIC) - Home — A primary industry reference for option pricing mechanics and Greeks.