How Retailers Use Data to Optimize Product Placement
Placement decisions look like merchandising intuition. Read the measurement behind them, and why a better model cannot fix a broken experiment.
Product placement is often described as an art — a buyer's eye for what will sell — and that description survives because the results of placement decisions are hard to interpret. A product placed at eye level sells more, but was it the placement, the promotion, the season, or the fact that the buyer chose a product already trending? Without a design that separates those causes, a retailer can spend years refining a model that is measuring its own decisions.
Direct answer:
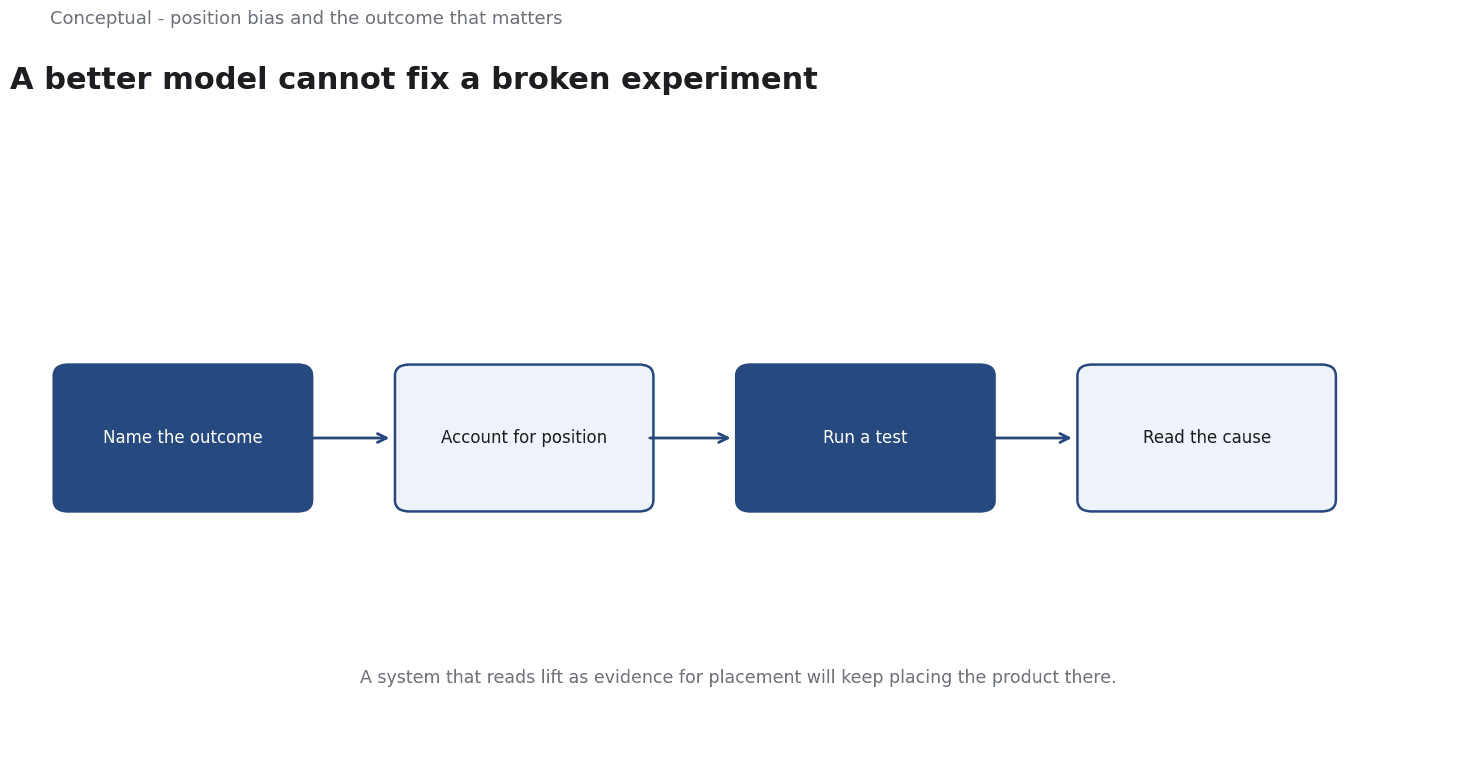
Retailers use data to decide which products appear where, in what order, and with which companions, and the useful systems share three properties: they measure the outcome the business cares about rather than the easiest signal, they account for position bias in the data they learn from, and they test changes with a design that can distinguish the effect of placement from the reasons the placement was chosen.
Google's event model is the operational starting point — "An event allows you to measure a specific interaction or occurrence" — because a placement system can only optimise behaviours that were actually recorded.
What placement actually controls
Placement is a mechanism for shaping the consideration set. A customer chooses among the options they encounter, and the retailer decides which options are encountered, in what order, and under what framing.
In a physical store this means shelf position, end-caps, aisle adjacency, and the planogram. Online it means ranking, category order, recommendations, sponsored results, and the layout of a search or browse page. Both are the same decision at different resolutions: allocate scarce attention to some products rather than others.
The objective is usually a combination of metrics — unit sales, gross margin, basket size, and sometimes strategic goals such as introducing a new brand. These objectives conflict. A product that sells quickly may have a low margin; a high-margin product may slow the aisle; an exclusive placement might increase category revenue while reducing total store revenue. The first job of a data system is to make that trade-off explicit rather than optimising a single number.
Where the data goes wrong
The central problem is position bias. Items in prominent positions are clicked and bought more because of the position, not only because of their underlying appeal. A model trained on that behaviour learns that the products it already placed prominently are the best products, and recommends them again. The system becomes self-confirming.
Three specific failures follow:
Feedback loops. A product gets exposure, generates sales, which justifies more exposure, while a worthy product that never gets displayed never generates the evidence needed to be displayed. This is the same mechanism that disadvantages new items in a recommender, and it is why a deliberate exploration budget is part of a sound design.
Confounded promotions. Placement and promotion are often decided together, so a sales lift cannot be attributed to either.
The only way to separate them is variation that changes one without the other.
Demand leakage. If last week's sales are used as a feature for this week's placement and no time gap is enforced, the model is partly reading the outcome it is trying to predict. This is the general leakage rule — "information that would not be available at prediction time" must not be used — applied to a retail calendar.
The National Retail Federation publishes the sales and channel data that puts these decisions in market context: which channels are growing, how categories are moving, and what the overall retail environment looks like. It is the right external benchmark, while the retailer's own experiments are the right internal evidence.
Designing a test that can answer the question
A placement experiment has to randomise the placement itself, not just measure before and after. Several constraints make this harder than a typical web test:
- Store-level interference. Changing one aisle can shift traffic to another, so the unit of randomisation may need to be the store or the region rather than the individual shopper. This is the same reasoning behind geo experiments in marketing measurement, where Google's published work describes a "systematic and effective design process" for market-level interventions.
- Seasonality and promotions. A test that spans a holiday or a price change is measuring a mixture unless those factors are held or modelled.
- Heterogeneous response. A placement that works in one store format may fail in another. Segmenting before the test is better than discovering the difference afterwards.
- Long enough horizon. A customer who buys a product once may not repurchase; a test that runs two weeks cannot measure loyalty effects.
The outcome metric should be gross margin or contribution, not units sold, and it should include the effect on the rest of the basket. A product that sells more while displacing a higher-margin neighbour is a loss.
A worked placement decision
The trade-off between unit sales and total contribution is easier to see with numbers. A prominent end-cap can hold one of two products:
- Product A sells 200 units a week at 10 margin per unit = 2,000 contribution. Shoppers who buy it also buy an average of 5 in other items.
- Product B sells 120 units a week at 18 margin per unit = 2,160 contribution. Its associated basket averages 2.
On the direct margin, B wins by 160. On total contribution including basket, A produces 200 × (10 + 5) = 3,000 while B produces 120 × (18 + 2) = 2,400. The "obvious" choice reverses when the basket is included — and this simple calculation still omits the effect on the rest of the aisle.
Two decisions follow. First, the objective has to be defined before the experiment: a team optimising unit velocity and a team optimising basket contribution will choose different products and both will be able to cite the data. Second, the associated-basket figure is itself an estimate that can be confounded — shoppers who buy A may be different people from those who buy B, so a controlled rotation of placements is needed rather than an observational comparison.
A third term often matters more than either: the effect of the placement on the category. If A draws customers into the aisle and B does not, the experiment needs to measure total category revenue, not just the end-cap. This is why store-level or region-level randomisation is sometimes necessary; a shopper-level test cannot capture an aisle-level effect.
When a model helps and when it does not
A model is useful when the number of placement decisions exceeds what a human can reason about, when the relevant patterns are stable enough to learn, and when the organisation can run the experiments that validate the model's recommendations. Large assortments with many stores meet those conditions; a small shop with a stable customer base usually does not.
The limits are worth stating. A model learned from past placement decisions inherits the biases of those decisions, and a model trained on a promotion-heavy period will over-value price sensitivity. scikit-learn's guidance on leakage and held-out evaluation applies directly: it is common practice to "hold out part of the available data as a test set", and for time-ordered retail data the split must respect chronology.
The right baseline is often a simple rule — place the highest-contribution products in the most prominent positions, subject to assortment constraints — and a model should beat that rule in a controlled test before it is trusted.
A working sequence
- Define the objective as contribution, including basket effects, not units alone.
- Record the events — impressions, position, promotions, and outcomes — with consistent definitions.
- Audit for position bias and leakage before training anything.
- Start with a simple rule and measure its performance.
- Run placement experiments at a unit that matches the interference structure.
- Reserve exploration capacity for products that have never been tried prominently.
- Segment the results by store format and season, and keep the segments comparable over time.
For the broader channel question, see Omnichannel Retail; for the experimental design, see A/B Testing.
A counterargument
A critic can push back that the article demands a level of experimental rigor its own worked example undermines. The end-cap reversal depends on associated-basket figures of 5 and 2 that the article immediately admits are confounded, so the confident conclusion rests on estimates it then discounts. The external sources do not close that gap: NRF channel data and AAPOR survey standards describe measurement and framing at a different level, while the Damodaran reference concerns valuation rather than placement at all.
The claim that a better model cannot fix a broken experiment is fair, but the article overstates how often a clean randomised test is available; when interference forces store-level assignment, its own constraints make the ideal test expensive or infeasible.
References & Further Reading
- National Retail Federation, 2026. NRF Press Releases | Latest Statements & Announcements | NRF — Primary retail-sales and channel data for sell-in versus sell-out definitions.
- Aswath Damodaran, 2026. Damodaran Online: Home Page for Aswath Damodaran — Publicly maintained datasets for industry averages, WACC, and valuation.
- American Association for Public Opinion Research, 2026. AAPOR — The professional association for public opinion and survey research; its standards and resources underpin the survey-design discussion.