Inventory Management: Balancing Stock and Cash Flow
Inventory is three investments at once: in service, in working capital, and in obsolescence. Read how the trade-off actually resolves.
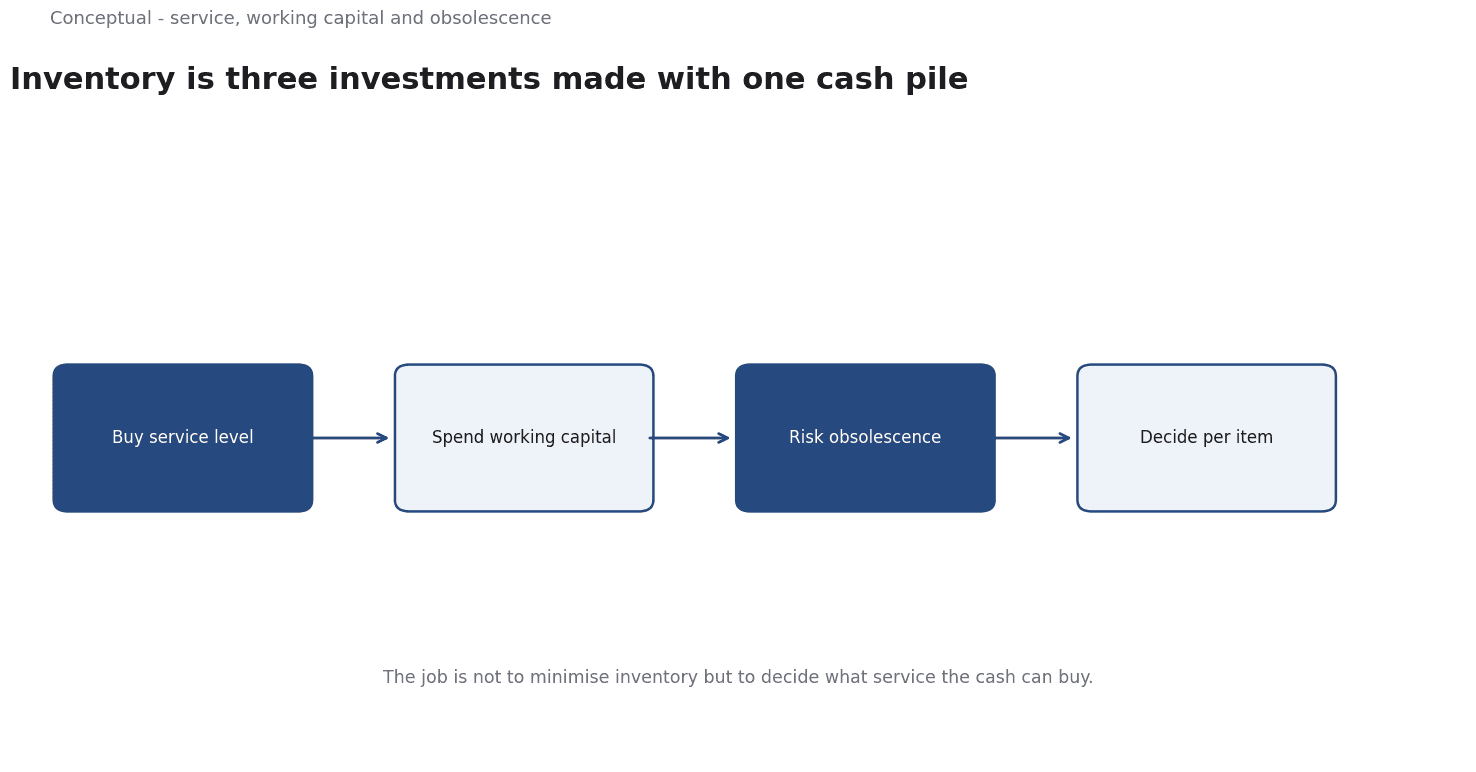
Inventory decisions are usually framed as a trade-off between two costs: carrying too much and running out. That framing is correct and incomplete, because inventory is not one thing. It is three separate investments made with the same cash, and they have different signs, different timescales, and different failure modes.
Direct answer: Inventory is simultaneously an investment in service level, a reduction in available cash, and a bet that the goods will still be worth something when they sell. Optimising "inventory" as a single number optimises the wrong thing, because the three components move against each other: the stock that protects against stockouts is the stock that ties up cash and ages.
The operational job is not to minimise inventory; it is to decide, per item and per location, how much service level the cash and obsolescence risk can buy.
The three costs, and why they do not add up nicely
The carrying cost. Cash sitting in a warehouse earns nothing and can be deployed elsewhere. Add storage, insurance, handling, shrinkage, and — for anything perishable or fashion-led — the cost of the space itself. This is the cost that makes inventory a working-capital decision, and it is why a business with thin margins can be brought down by a successful sales quarter.
The stockout cost. A missing item does not merely lose one sale. It loses the basket, it may push the customer to a competitor for the category, and in a repeat-purchase business it can end the relationship. This is why availability targets are usually set high for high-margin, high-consideration items and low for the long tail.
The obsolescence cost. This is the one that gets left out of the spreadsheet, because it only appears later. Perishable stock loses value with age; technology stock loses value when the next generation launches; fashion stock loses value when the season turns. A business can hold "adequate" stock of an item that is no longer sellable, and the accounting will not flag it until it is written down.
The reason the three do not sum cleanly is that they are measured on different clocks. The stockout cost is immediate and visible. The carrying cost accrues quietly. The obsolescence cost arrives later and is often attributed to something else entirely — a category manager, a buyer, a season.
The arithmetic that decides the trade-off
The classic framing is the newsvendor problem, and it is worth stating because it shows why "the right level of inventory" is a function of four things rather than a target.
Let the shortage cost be the margin you lose when a customer cannot buy. Let the overage cost be the loss when you hold stock that sells below cost or does not sell at all. The fraction of the "critical ratio" — how likely you want to be in stock — is the overage cost divided by the sum of overage and shortage costs. The higher the cost of a stockout relative to the cost of excess, the higher the service level you should run.
Two practical consequences follow. First, the optimal service level is a property of the item, not of the business: a high-margin item with expensive substitution deserves a higher level than a commodity with a low margin and an easy substitute. A single company-wide service target destroys value in both directions. Second, the ratio moves as the item's economics move, which is why a static target set last year is usually wrong for this year's assortment.
The less commonly used insight is that this calculus is about marginal decisions on individual items. A total inventory number is an output of the process, not an input to it. Setting a total and then trying to allocate it across a catalogue is how organisations end up with stock in the wrong places.
Working capital is where inventory actually bites
Inventory is the largest asset on the balance sheet of most retailers and manufacturers, and it converts cash into goods on the expectation of a sale. The cash-conversion cycle — days of inventory plus days of receivables, minus days of payables — is the number a lender looks at, and reducing inventory days releases cash immediately without requiring a single extra sale.
The industry data makes the scale concrete. The National Retail Federation publishes the retail-sales and channel figures that put inventory behaviour in context against the overall market: sales are not the constraint, the stock behind them is. Inventory that grows faster than sales is a warning sign, and it is a warning that appears in cash flow before it appears in profit.
There is a temptation to treat this as a pure finance exercise — squeeze the cycle, release the cash, improve the balance sheet.
A practical sequence
- Segment the catalogue by economics, not by category. Group by margin, substitution availability, and demand variability. These determine the service level.
- Set service levels per segment using the critical-ratio logic, and write down the assumption for each. A target without a stated cost ratio is a preference.
- Measure the three costs separately — stockout incidence and cost, carrying cost, and ageing — so you can see which one is actually binding.
- Segment inventory by age, and decide the disposal policy before the age arrives. Markdown decisions made under pressure are always worse than markdown decisions made in advance.
- Track inventory days against sales, not against a budget. A seasonal business should compare like periods, and the comparison should be at the item level, not the total.
- Re-check the supplier lead time assumption regularly, because the optimal safety stock is a function of lead-time variability and that changes when a supplier, a route, or a port changes.
For the channel and assortment questions that determine what you stock, see Why Product Assortment Matters More Than Having More Products and Omnichannel Retail.
A worked example
The following is hypothetical and illustrative. Picture a retailer holding two items: a high-margin accessory with few substitutes and a low-margin commodity with many. Three checks apply the article's logic. First, each item is assigned a service level from the critical ratio rather than a single company-wide target, so the accessory gets a higher in-stock probability than the commodity. Second, the three costs are measured separately: stockout incidence, carrying cost, and stock age, so the team can see which one is binding instead of guessing. Third, inventory days are tracked against sales at the item level and compared like-for-like across seasons, with the supplier lead-time assumption re-checked. In this imagined case the accessory's higher availability is justified, the commodity's stock is trimmed, and the cash-conversion cycle shortens without a service collapse. Total inventory falls as an output of those decisions, not as a target imposed on them.
A counterargument
A reasonable critic would push back that the whole framework rests on estimating a shortage cost, an overage cost, and a demand distribution for each item, and those are exactly the numbers a business knows least well for the long tail where the article says the method matters most. The article itself concedes that obsolescence is "left out of the spreadsheet" and arrives late, yet the critical-ratio logic needs that overage cost up front. The National Retail Federation figures cited for context are aggregate sales, not item-level demand, so they cannot validate a per-item service target.
Where demand is sparse or items are correlated, the calculus is precise about inputs that are themselves guesses, and the framework's confidence exceeds its evidence.
References & Further Reading
- National Retail Federation, 2026. NRF Press Releases | Latest Statements & Announcements | NRF — Primary retail-sales and channel data for sell-in versus sell-out definitions.
- U.S. Securities and Exchange Commission (Investor.gov), 2026. Introduction to Investing — Primary regulator guidance on market mechanics and investor protection.
- Federal Reserve Bank of St. Louis, 2026. FRED economic data — The primary time-series database used for macro indicators.