Market Research: Survey Design, Conjoint Analysis, and MaxDiff
Survey answers depend on how questions are asked. Read the design mechanism, a sample-size worked example, and where stated preference stops being reliable.
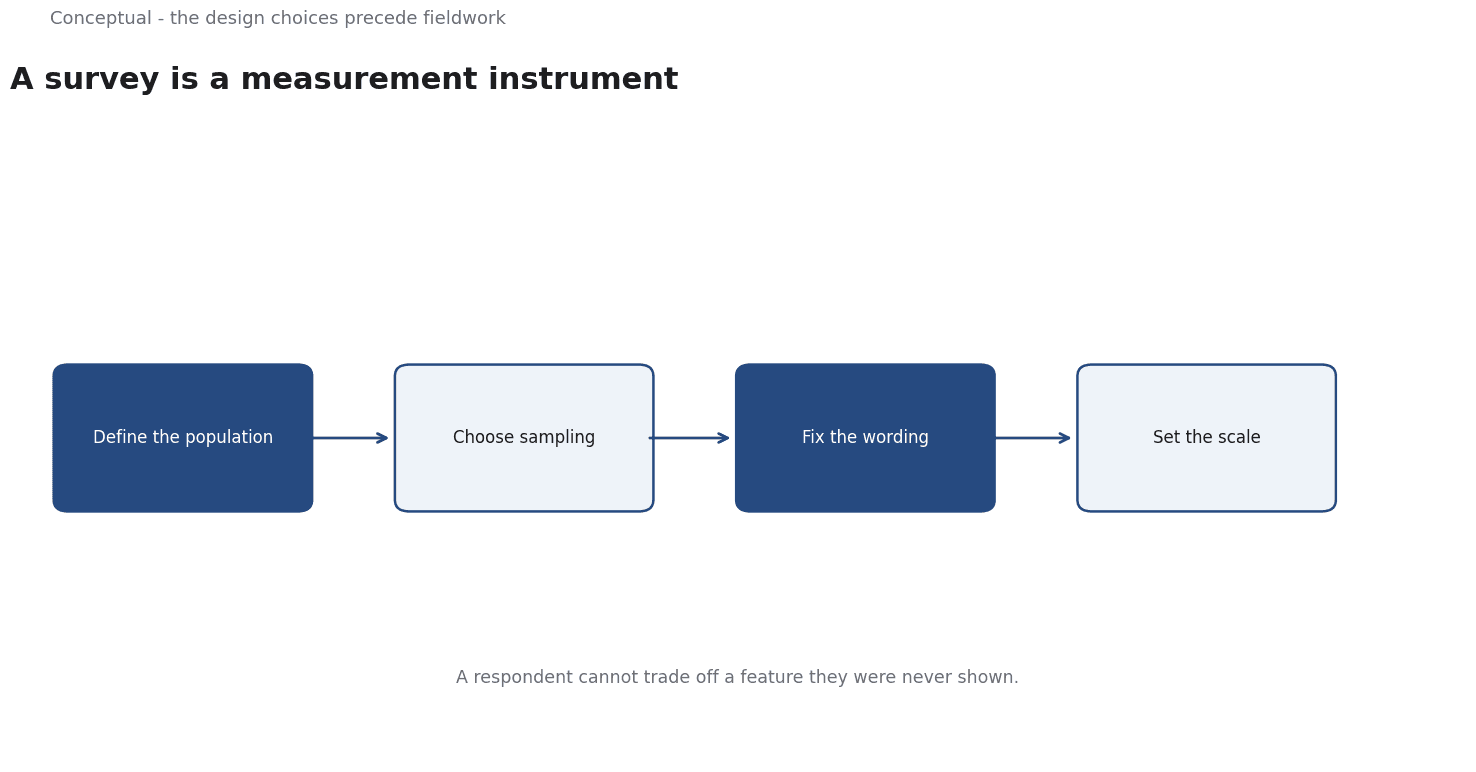
A survey is a measurement instrument, and like any instrument it can be badly calibrated. A question that is easy to answer may produce a number that is easy to quote and hard to use. The difference between research that guides a decision and research that decorates a slide is mostly in the design choices made before fieldwork begins.
Direct answer:
Good survey design defines the population, the sampling method, the question wording, and the measurement scale before collecting responses.
The American Association for Public Opinion Research is the professional body whose standards and resources underpin this discipline. Conjoint analysis and MaxDiff go further by asking respondents to make trade-offs rather than rate attributes in isolation. The boundary: stated preferences are not revealed behaviour, and no design removes the gap between what people say and what they do.
Start with the decision, not the questionnaire
Four questions come before writing a single item:
- What decision will this inform? "Understand customers" is not a decision; "choose which of three package designs to launch" is.
- What is the population? A survey of existing customers cannot tell you why non-customers did not buy.
- How will respondents be selected? A convenient sample produces a precise-looking number about the wrong group.
- What answer would change the decision? If every possible result leads to the same action, the research is theatre.
The U.S. Census Bureau's Business Trends and Outlook Survey is a useful reference for the operational side of repeated measurement: a systematic, recurring instrument with a defined population and published methodology. The point is not the specific survey but the discipline — consistent wording and a known sampling frame make changes over time interpretable.
Question wording is a design variable
Three effects are worth guarding against:
Leading wording. "How much do you love our new feature?" presupposes the answer. Neutral wording asks about a behaviour or an evaluation without embedding the conclusion.
Double-barrelled items. "Was the product easy to use and reliable?" conflates two attributes. A respondent who finds one true and the other false has no honest answer.
Scale interpretation. A 1–5 rating means different things to different respondents unless the endpoints are labelled. Even then, some people avoid extremes and others use them freely, so a mean score is a summary of a distribution, not a universal quantity.
A practical test: read each question aloud to a colleague and ask them what they think it is asking. If their interpretation differs from yours, rewrite it.
Conjoint and MaxDiff measure trade-offs
Direct ratings have a weakness: respondents can say that every attribute is important. Trade-off methods force choices.
Conjoint analysis presents respondents with combinations of product attributes — price, features, brand — and asks which they would choose. By varying the combinations systematically, a researcher can estimate how much each attribute contributes to the choice. The output is a set of relative weights under the specific attributes and levels shown; it is not a universal measure of value.
MaxDiff (maximum difference scaling) shows a small set of items and asks which is most and least important. Repeating this across different subsets produces a rank order with more discrimination than a simple rating scale, because each comparison is relative.
Both methods share a limitation: they measure preferences within the frame the researcher constructed.
A worked example of sample size
The following numbers are hypothetical and illustrative.
Suppose a retailer wants to estimate the share of customers who would choose a new delivery option, with a margin of error of ±5 percentage points at 95% confidence. For a proportion near 50% — the most conservative case — the required sample size is approximately:
n = (1.96² × 0.5 × 0.5) / 0.05² ≈ 385
So roughly 400 completed responses are needed. Three practical adjustments follow:
- Nonresponse. If 30% of invited people do not complete the survey, invitations must be sent to about 385 / 0.7 ≈ 550 people to reach 385 completions. The people who do not respond may differ systematically from those who do, and no sample size fixes that bias.
- Subgroup analysis. If the decision requires separate estimates for three regions, each region needs about 385 responses, not the total split three ways. A national sample of 400 gives roughly 133 per region, with a much wider margin of error.
- Design effect. Conjoint and MaxDiff produce many observations per respondent, but those observations are correlated within a person. Treating them as independent inflates the apparent precision. The unit of analysis is the respondent, not the choice.
The arithmetic is simple; the discipline is in stating the assumptions — confidence level, expected proportion, subgroup requirements — before collecting data, so the design can be checked against the decision.
What surveys cannot establish
Three limits deserve more than a disclaimer.
Stated preference is not behaviour. A respondent who says they would buy at a price may not do so when the price is real. Conjoint results are useful for relative prioritisation and risky as absolute demand forecasts.
Samples are not populations. Weighting can adjust a sample to known population totals, but it cannot fix a sampling frame that excluded the group you care about. Non-response bias is a design problem, not an analysis problem.
Correlation is not causation. A survey can show that satisfied customers recommend a product more often. It cannot tell you whether satisfaction caused the recommendation or whether both reflect a third factor, such as a customer's general disposition.
The counterargument to rigorous design — that business decisions are made quickly and imperfect information is better than none — is fair.
The appropriate response is to state the uncertainty and make the decision reversible where possible, not to present a weakly designed number as precise.
A decision test
- State the decision and what result would change it.
- Define the population and check that the sampling frame covers it.
- Write neutral, single-idea questions with labelled scale endpoints.
- Estimate sample size with explicit assumptions, including subgroups and nonresponse.
- Use trade-off methods when the decision requires prioritisation.
- Analyse at the respondent level, not the individual choice level.
- Label stated preferences as such and avoid presenting them as demand forecasts.
For the analytical context, see A/B Testing; for the business framing, see How Data Changes the Way Marketing Decisions Are Made.
References & Further Reading
- American Association for Public Opinion Research, 2026. AAPOR — The professional association for public opinion and survey research; its standards and resources underpin the survey-design discussion.
- U.S. Census Bureau, 2026. Business Trends and Outlook Survey — Official small-business AI adoption measurement.