How Data Changes the Way Marketing Decisions Are Made
Marketing data changes decisions only when it arrives before the decision and is tied to an outcome. Read what to instrument and what to distrust.
Marketing teams have more data than ever and often make the same decisions as before, because the data arrives in a form that cannot change the choice. The dashboard reports what happened; the decision needs to know what would have happened otherwise. The gap between those two is where most marketing analytics fails.
Direct answer:
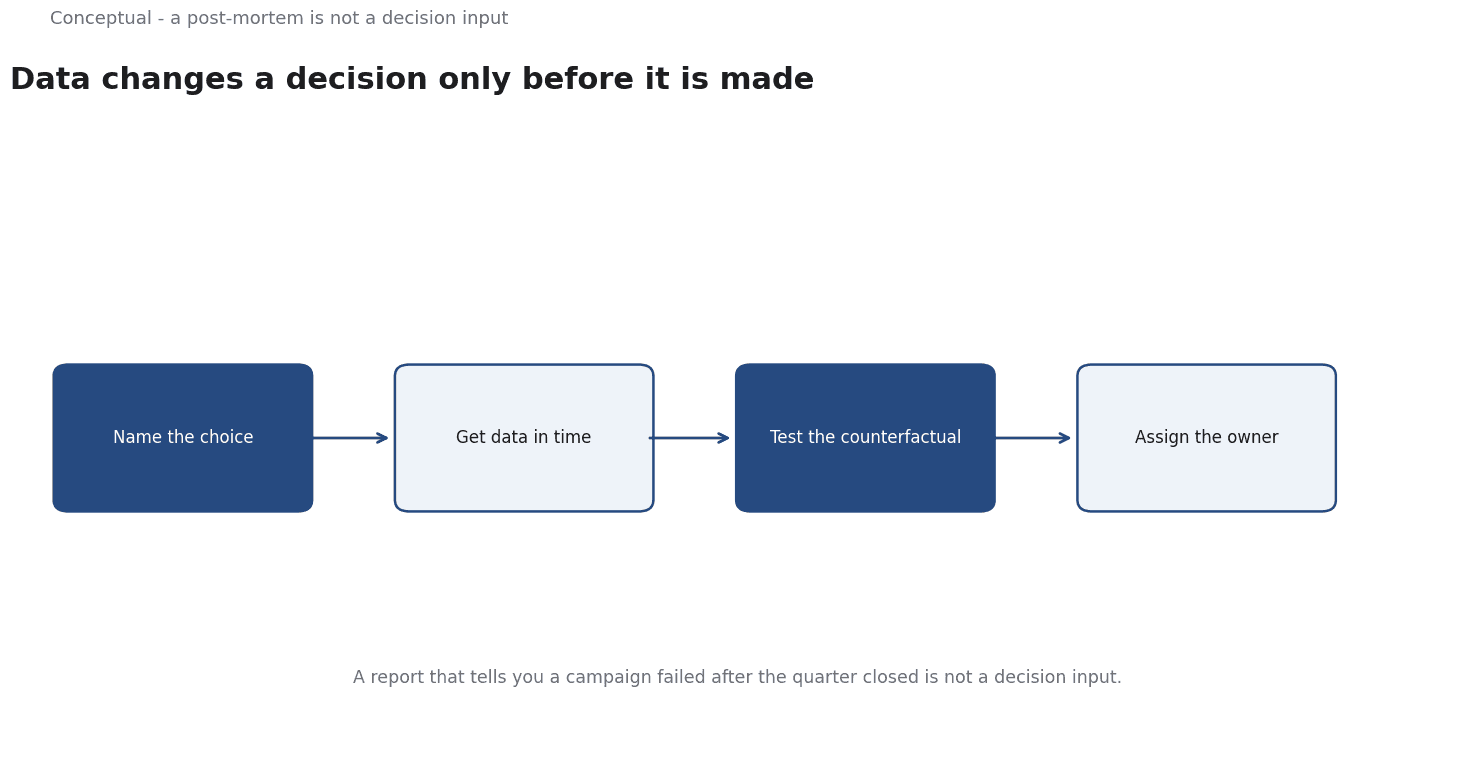
Data changes a marketing decision when it is timely, tied to a counterfactual, and attached to a specific choice with an owner.
The three instruments that matter are experiments for interventions that can be randomised, geo experiments for those that cannot, and attribution models understood as rules rather than measurements. The attribution-versus-incrementality argument is developed in Marketing Attribution; this article focuses on making data arrive in time to be used.
From reporting to deciding
The default form of marketing analytics is a report: spend by channel, conversions by channel, cost per acquisition, trend lines. It is descriptive and it is useful for detecting that something changed, but it cannot answer "should we do more of this?" because it has no counterfactual.
The shift to a decision instrument happens with one addition: a statement of what would have happened otherwise. For an intervention that can be assigned at random, that is an experiment. For one that cannot, the alternative is a design that constructs a comparison at the level where the intervention operates.
Google's published work on geo experiments states that "one approach that Google has successfully employed to measure advertising effectiveness is geo experiments", and describes them as having "a systematic and effective design process" with results that are "easy to interpret". The value of the approach is not the geography as such; it is that it creates a counterfactual for a decision — a market-wide campaign — that user-level randomisation cannot.
Attribution cannot answer the decision question
When teams talk about "data-driven marketing", they often mean a multi-touch attribution model. A model that splits credit across touches applies a rule; it does not measure what would have happened without the spend. The full treatment — why the model is a choice, how incrementality differs, and how to use both in a budget process — is in Marketing Attribution.
The relevant point here is narrower: an attribution output is descriptive, and a report cannot become a decision input simply by being more precise. The counterfactual has to come from somewhere else.
The data has to arrive in time
A second failure mode is temporal.
The design question is the delay between the event being measurable and the decision it should inform. Long-cycle purchases make this hard, and the honest response is to shorten the measurement loop where you can — leading indicators that are cheap to measure, tested against the eventual outcome — rather than to wait and hope.
Survey-based market research has a parallel discipline worth borrowing. The American Association for Public Opinion Research publishes standards and ethics for research, and the principle that transfers is that a claim should record who was asked, how they were selected, and what the sample can support. Marketing data deserves the same disclosure, and it rarely gets it.
Instrument the decision, not the channel
What should a marketing team actually record? The answer follows from the decisions it makes repeatedly:
- Which offer was shown to which person in which context. Without this, no experiment can be reconstructed.
- What the outcome was, including downstream value — the kept order, the retained customer, the margin — not only the immediate conversion.
- The pre-experiment behaviour needed for variance reduction. CUPED "utilizes data from the pre-experiment period to reduce metric variability and hence achieve better sensitivity", with a reported variance reduction of about 50% on Bing. If you cannot tie pre-period behaviour to the same user, you cannot use the method.
- The decision that was made on the basis of the data, so you can later check whether the recommendation was followed and what happened.
The last item is the one almost nobody keeps, and it is the only way to learn whether your analytics function changes outcomes or merely produces documents.
A checklist for the next decision
- Name the decision and its owner before you request the analysis.
- Ask what the counterfactual is. If nobody can say, the report cannot answer the question.
- Choose the instrument: randomisation for user-level interventions, geo experiments for market-level ones, attribution for description only.
- State the model's assumptions out loud. "We used last-click" is a choice that another team should be able to challenge.
- Check the timing. Will the answer arrive before the decision?
- Record the outcome and the decision, including when they disagreed.
- Review the archive quarterly. A list of decisions and their actual results is the only marketing dataset that improves over time.
For the attribution question in channel economics, see SEO vs Paid Advertising; for the experimental design, see A/B Testing.
A worked example
The following is hypothetical and illustrative. A team must decide whether to expand a market-wide campaign and asks what data can change the choice before the budget is set. Check one, name the counterfactual and the instrument: following the geo experiment work of Vaver and Koehler, the team constructs a comparison at the market level, because user-level randomisation cannot answer a market-wide question and a multi-touch attribution split is a rule, not a measure of what would have happened otherwise. Check two, check the timing: the comparison must read out before the decision closes, and pre-period behaviour tied to the same user is recorded so CUPED can reduce metric variability, as Kohavi, Tang, and Xu describe, rather than waiting for a post-mortem after the quarter. Check three, disclose what the sample supports: following AAPOR's standards, the record states who was measured, how they were selected, and what the comparison can support. The bounded outcome is a recommendation the owner can act on or decline within the cycle; decisions and outcomes are archived so the next quarter reviews whether the analysis changed results.
A counterargument
An objection is that the article sets a standard few decisions can meet. Its own first section calls descriptive reports 'useful for detecting that something changed,' then spends the rest demoting anything without a counterfactual to a post-mortem or a document. But the instruments it recommends have preconditions it does not state: geo experiments need enough comparable markets for a credible comparison, and CUPED needs pre-period behaviour tied to the same user, which the article itself notes is often unavailable. For a small team with few markets and no identity resolution, the checklist names a decision, a counterfactual, and an instrument, yet supplies no measurement that will actually run.
A reasonable critic would say the piece confuses an ideal standard with a usable method: description is not a decision input by itself, but insisting on a counterfactual for every decision leaves most teams choosing between weak attribution and no data at all.
References & Further Reading
- Kohavi, Tang, and Xu, 2013. CUPED — ExP Platform — Using pre-experiment data to reduce metric variability; the Bing result cut variance by about 50 percent, giving the same power with half the users or half the duration.
- Brian Vaver and Koehler, 2011. Measuring Ad Effectiveness Using Geo Experiments — Geo experiments for incrementality, the cleanest way to attribute marketing spend.
- American Association for Public Opinion Research, 2026. AAPOR — The professional association for public opinion and survey research; its standards and resources underpin the survey-design discussion.