Retention Analytics: Common Questions
A single retention rate hides when customers were acquired. Read how cohort analysis connects retention measurement to a decision, with claim status explicit.
Teams often report one retention number as if it were a fact about the product. That number mixes customers acquired at different times and under different conditions, so it cannot show whether a change worked. The two sources frame the fix: customer retention defines what is being retained, and cohort analysis groups customers so comparisons are fair.
Direct answer: Measure retention within cohorts of customers who started in the same period, then compare cohorts at the same age rather than at the same calendar date. State whether the metric counts customers or revenue, and tie the number to a decision it would change.
Delta: This article adds a claim-status table beyond the sources: it maps cohort-based retention measurement to a concrete spending decision, with claim status explicit.
The mechanism
Customer retention describes the fraction of customers a business keeps over a defined period, with churn as its complement. Both depend on a denominator and a window: a monthly logo-retention figure and an annual revenue-retention figure can move in opposite directions for the same business. The first practical consequence is to define the event that marks the start of the clock, whether that is signup, first purchase, or first payment, because each choice produces a different cohort and a different rate.
Cohort analysis groups customers by a characteristic they share, most usefully the period in which they began. The source describes it as a way to observe how a group behaves over time. A cohort that signed up in July can be compared with one that signed up in August at the same month index, which removes the distortion that comes from a growing base or from seasonality. The practical consequence is that a matched-age comparison answers a question the headline rate cannot: did customers acquired under the new onboarding retain better than those acquired under the old one?
An aggregate retention rate can change for reasons that have nothing to do with product quality. If a large recent cohort has not yet had time to churn, it lifts the average; if acquisition shifts toward a channel with lower early retention, the average falls. Cohorts expose that mix, because each group is tracked separately and weighted by its own exposure period.
Reading the curve by cohort age, rather than by calendar month, is the control that turns a descriptive statistic into something closer to a diagnostic.
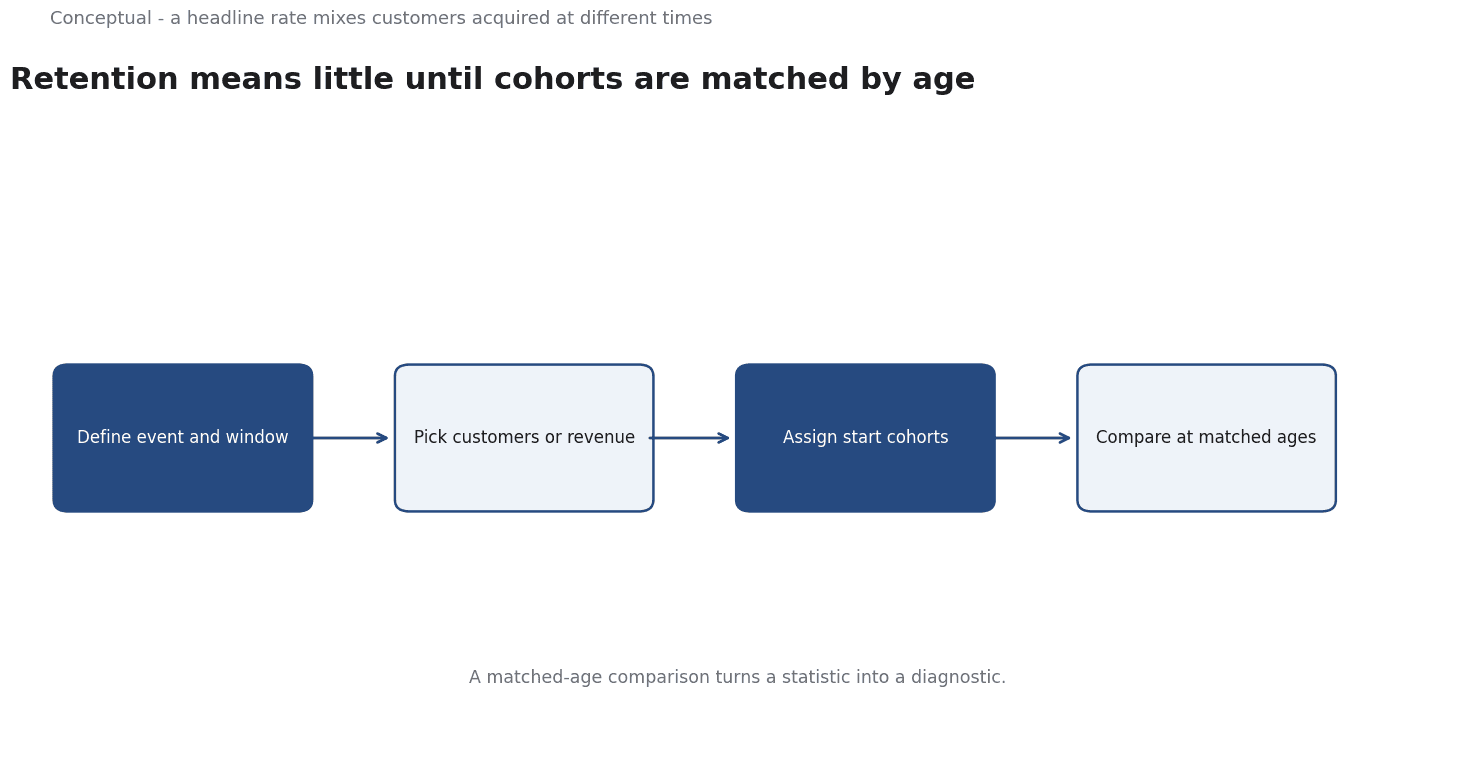
The sequence is therefore: define the retention event and window, choose whether to count customers or revenue, assign each customer to a start cohort, and compare cohorts at matched ages. Each of those choices is local to the team, so the resulting guidance is inferred; the underlying definitions are source-reported. Making the choices visible is what lets a reviewer challenge a conclusion instead of accepting the headline.
A worked example
The following is hypothetical and illustrative. A subscription team sees reported monthly retention fall from 92 percent to 88 percent and proposes cutting onboarding spend. Three checks decide whether that conclusion holds. First, are the two figures built from cohorts of the same age, or did a large new signup group dilute an average that was never like-for-like? Second, is retention measured by customer count or by revenue, since a few large accounts changing status can move one and not the other? Third, do the older cohorts show a stable curve at each matched month index, which would suggest the drop is a mix artifact rather than a real change? When the analyst re-cuts the data by signup cohort at matched ages, the curves are flat and the headline decline is a composition effect. The proposed spend cut is put on hold. The scenario is illustrative; the discipline of matching cohorts is the point.
Evidence status
| Claim | Status | Source | Verified | Recheck when |
|---|---|---|---|---|
| Retention measures customers kept over a period | source-reported | Customer retention (Wikipedia) | 2026-11-18 | Churn definition changes |
| Cohort analysis groups users by a shared start period | source-reported | Cohort analysis (Wikipedia) | 2026-11-18 | Method definition changes |
| Matched-age cohorts reduce mix distortion | inferred | Derived from the sources | 2026-11-18 | Acquisition mix or product changes |
The table separates what the sources state from what this article derives. The first two rows describe definitions from the retention and cohort-analysis entries; they are source-reported and should be revisited if those references change. The third row is inferred: matched-age comparison reducing mix distortion follows from the cohort idea but is a judgement about use, so it should be rechecked whenever acquisition mix or product changes.
What it cannot do
Retention analytics is descriptive. A cohort curve shows that a group retained at a lower rate in month three, but it does not say why. The cause might be a pricing change, an onboarding defect, or a shift in who was acquired, and the curve alone cannot distinguish among them.
A team that sees a dip and immediately changes the product is acting on a correlation it has not tested, and the change may do nothing or make things worse.
Cohorts are only as good as the timestamp that defines them. Signup date, first-purchase date, and first-payment date are different events, and grouping by the wrong one assigns customers to a cohort that does not reflect their real start. Because every downstream comparison inherits that grouping, a single inconsistent timestamp can misgroup an entire history. The hidden cost is not the analysis but the discipline of maintaining a stable, well-defined anchor across systems that rarely agree on what a start is. That work is unglamorous and easy to skip.
Two failure modes dominate. Early cohorts are small and their percentages are noisy, so a one-customer change can look like a trend. Late cohorts are truncated, because a group that started two months ago has no month-twelve value yet; reading its current retention as if it were complete is a right-censoring error. Comparing a mature cohort with a truncated one at a common calendar date produces a decline that is purely an artifact of observation windows, yet it is exactly the comparison a dashboard invites.
Even a clean cohort comparison does not establish that an intervention caused a change. That requires a counterfactual, such as a holdout or an experiment, which retention reporting by itself does not provide. The method also says nothing about customers who never entered, so it cannot speak to acquisition quality except through the composition of those who did. A retention dashboard is a lens on existing customers, not a full account of the business, and it should be read that way.
Definitions drift. A team that changes its billing cycle, its definition of an active customer, or the event that starts the clock has silently changed the metric, and historical cohorts may no longer be comparable to new ones. Any conclusion should be rechecked when product, pricing, or instrumentation changes, and the window and metric should be restated beside the number. Without that review, a cohort chart slowly becomes a record of defunct definitions that no one remembers changing.
The counterargument that a single retention number is fair for a quick health check and incomplete for diagnosing what changed is reasonable: a simple rate can flag that something moved, but only cohort detail can show when and for whom.
A decision test
- Define the retention event and the window it measures.
- State whether the metric counts customers or revenue.
- Assign every customer to a cohort by a shared start period.
- Compare cohorts at matched ages, not at calendar dates.
- Check for mix shifts and truncated cohorts before declaring a change.
- Name the decision the number would change.
- Restate definitions and recheck when product, pricing, or instrumentation changes.
Used this way, retention analysis becomes a decision input rather than a status report. Each step makes an assumption challengeable, so a reviewer can see whether a claimed decline survives a fair comparison. The goal is not a more precise percentage but a number whose meaning is stable enough to act on.
For further reading, see Marketing Dashboards without the Hype.
References & Further Reading
- Wikipedia contributors, 2026. Customer retention - Wikipedia — Efforts to keep existing customers.
- Wikipedia contributors, 2026. Cohort analysis - Wikipedia — Grouping users by shared start period for comparison.