The Yield Curve Shape: What It Signals and Does Not
A yield curve is a snapshot of rates across maturities. Read what its shape means, a worked example, and why it is not a forecast.
The yield curve is a line connecting the yields of bonds with different maturities. It is watched closely because its shape appears to summarize expectations about rates and the economy. That is useful and dangerous in equal measure: the curve is a market price, which means it reflects expectations, risk premia, and supply conditions at once.
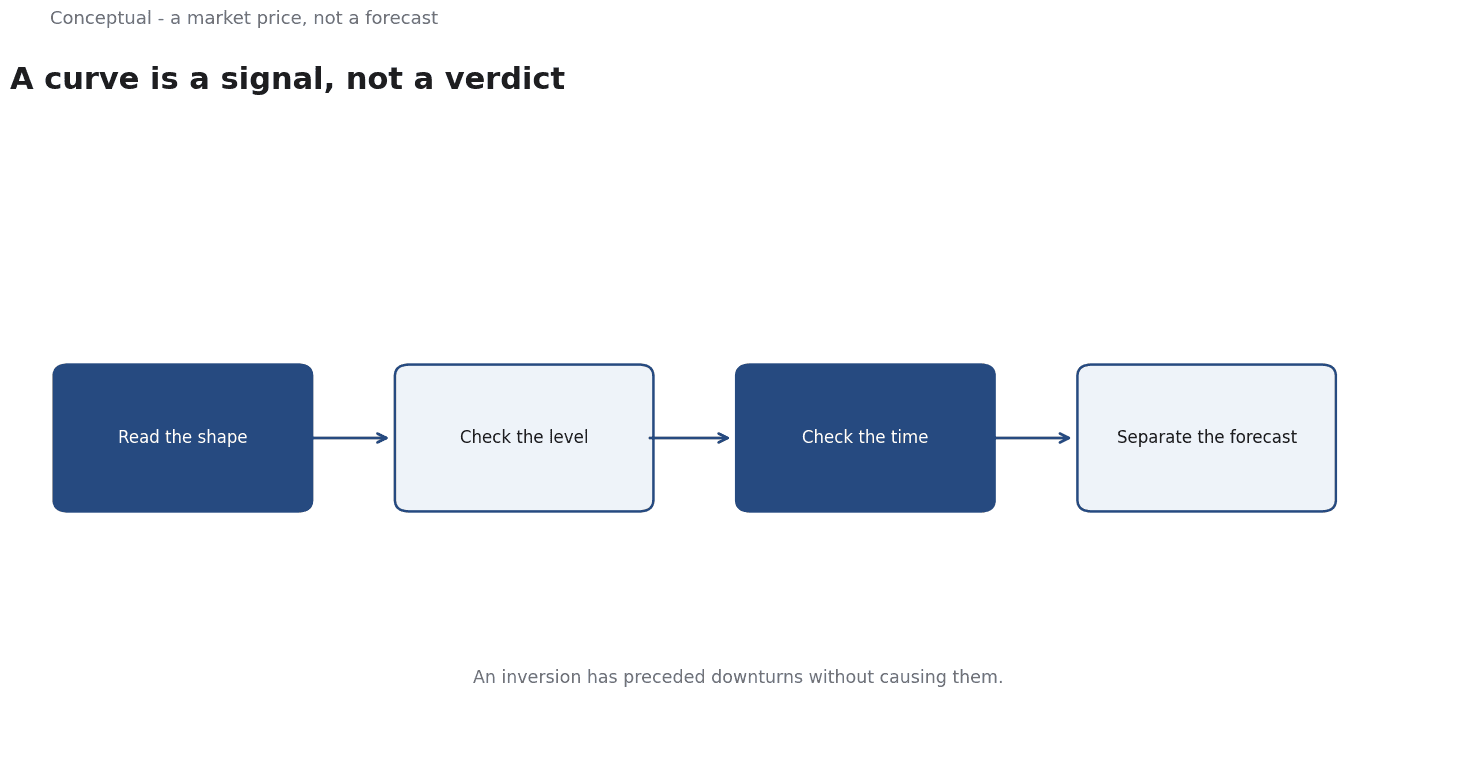
Direct answer: An upward-sloping curve means longer-term yields are higher than short-term ones; an inverted curve means the reverse. FRED publishes dated yield series, and the fixed-income article explains how yield and price relate. The boundary: the curve is not a forecast of recession or growth, and an inversion has preceded downturns without causing them, which the causal-inference article treats as a distinction between association and causation.
The curve is a signal that invites investigation, not a verdict.
Reading the curve over time
A single curve is a photograph of one moment, and much of its meaning lies in the movement. An inversion that deepens over several weeks carries different information from one that appears for a day, which the FRED series with dated observations makes visible. The change in the short end is often driven by policy expectations, while the long end responds to growth and inflation expectations and to the supply of safe assets, as Central Banking: Monetary Policy, Inflation Targeting, and Financial Stability explains for the tools that act at different maturities.
The practical habit is to plot several maturities together over a long window and ask what changed. A steepening curve can mean that short rates fell faster than long rates, or that long rates rose on inflation concerns, which are different stories with different implications, as the macroeconomics article treats the joint reading of indicators.
For a borrower or investor, the shape has direct consequences. A steep curve rewards longer commitments differently from a flat one, which the fixed-income article explains through the relationship between yield and price. A company issuing debt chooses a maturity in that context, as the debt-restructuring article treats the terms as consequential. Reading the curve is therefore an operating skill, not only a macroeconomic pastime.
What the shape reflects
Expectations of future rates. If investors expect short rates to fall, longer yields may be lower than current short rates. This is one component, which is why a curve is sometimes read as a consensus forecast.
Term premia. Investors generally require compensation for lending longer, which tends to push long yields above short ones. The size of that premium varies, which the credit-spreads article treats as a question of what a yield difference includes.
Supply and demand. Issuance patterns, central-bank purchases, and the demand for safe assets affect particular maturities differently, as Central Banking: Monetary Policy, Inflation Targeting, and Financial Stability explains for policy tools that act on the long end.
Three consequences follow. A curve can invert for reasons that have little to do with expected growth. A single day's shape is noisy, which the FRED data with dates and release history helps interpret. And comparing countries requires care because their currencies and policy regimes differ, as the international-finance article treats exchange-rate contexts.
A worked example
The following is hypothetical and illustrative. A three-month government bill yields 5%, a two-year note 4.6%, and a ten-year bond 4.2%. The curve is inverted across those maturities.
Three readings are possible. The market expects short rates to fall, which is consistent with an eventual slowing economy. Or demand for long-dated safe assets has pushed their yields down regardless of expectations, which the energy and flight-to-quality literature treats as a demand shock. Or a central-bank asset programme has compressed the long end, as Central Banking: Monetary Policy, Inflation Targeting, and Financial Stability explains for policy effects.
Three checks decide what can be claimed. First, look at the change over time rather than one day, which the FRED series supports. Second, compare with other indicators — employment, credit spreads, and inflation expectations — as the macroeconomics article recommends for a joint reading. Third, avoid turning an inversion into a specific trade without a view on why it occurred, which the causal-inference article warns about for associations.
Three conclusions follow. Its components cannot be separated from the shape alone. And a forecast based on it should carry explicit assumptions, as the valuation article recommends for any conditional claim.
What the curve cannot do
It cannot time a downturn, which the financial-crises article treats as a question of mechanism and contagion rather than one indicator. It cannot tell you what the central bank will do, which the central-banking article explains as a policy decision with multiple inputs. And it does not apply uniformly to corporate bonds, where credit spreads add a separate component, as the credit-spreads article explains.
The counterargument that the curve is useless because it has been wrong is too strong.
It is noisy evidence about expectations, which the macroeconomics article treats as one input among several, as the yield-curve literature would predict.
A decision test
- Plot yields from a dated primary source such as FRED.
- Look at the change over months, not a single day.
- Separate expectations, term premia, and demand conditions as possible drivers.
- Compare with other macro indicators, as the macroeconomics article recommends.
- Treat inversions as signals, not forecasts, which the causal-inference article advises.
- Distinguish government from corporate curves, as the credit-spreads article requires.
- Record the assumptions behind any conclusion, as the valuation article recommends.
For the policy context, see Central Banking; for the fixed-income mechanics, see Fixed Income Markets.
References & Further Reading
- Federal Reserve Bank of St. Louis, 2026. FRED economic data — The primary time-series database used for macro indicators.
- FINRA, 2026. Introduction to Investing (SEC Investor.gov) — Regulator explanation of market mechanics, bonds, and investor protection.