What Marketing Dashboards Actually Measures
A dashboard measures recorded events, not importance. Learn the source definitions, a decision-linked example, and why displayed metrics cannot establish cause.
A marketing dashboard collects metrics into one view so a team can see what is happening. The web analytics entry describes the collection and reporting of site data, and the decision making entry describes how choices are made from information. The real problem is that a dashboard measures what was instrumented, not necessarily what matters for a decision.
Direct answer: A dashboard measures recorded events such as visits, form fills, and spend, aggregated over a chosen period. The sources describe what web analytics collects and how decisions use information; the rule that a metric must serve a decision is a synthesis. A number on a screen is evidence only when someone can act on it.
Delta: This article adds a claim-status table and a decision-linked metric test beyond the sources: it maps each displayed metric to the choice it supports, with claim status explicit.
The mechanism
Web analytics is the collection, reporting, and analysis of web data. It records events such as page views, sessions, referrals, and conversions, then aggregates them into metrics. The decision making entry frames information as input to a choice among alternatives. A dashboard joins these two ideas: it presents collected data so that a decision maker can compare options. In the sources, the measurement and the use of measurement are described separately, and the dashboard is where they meet.
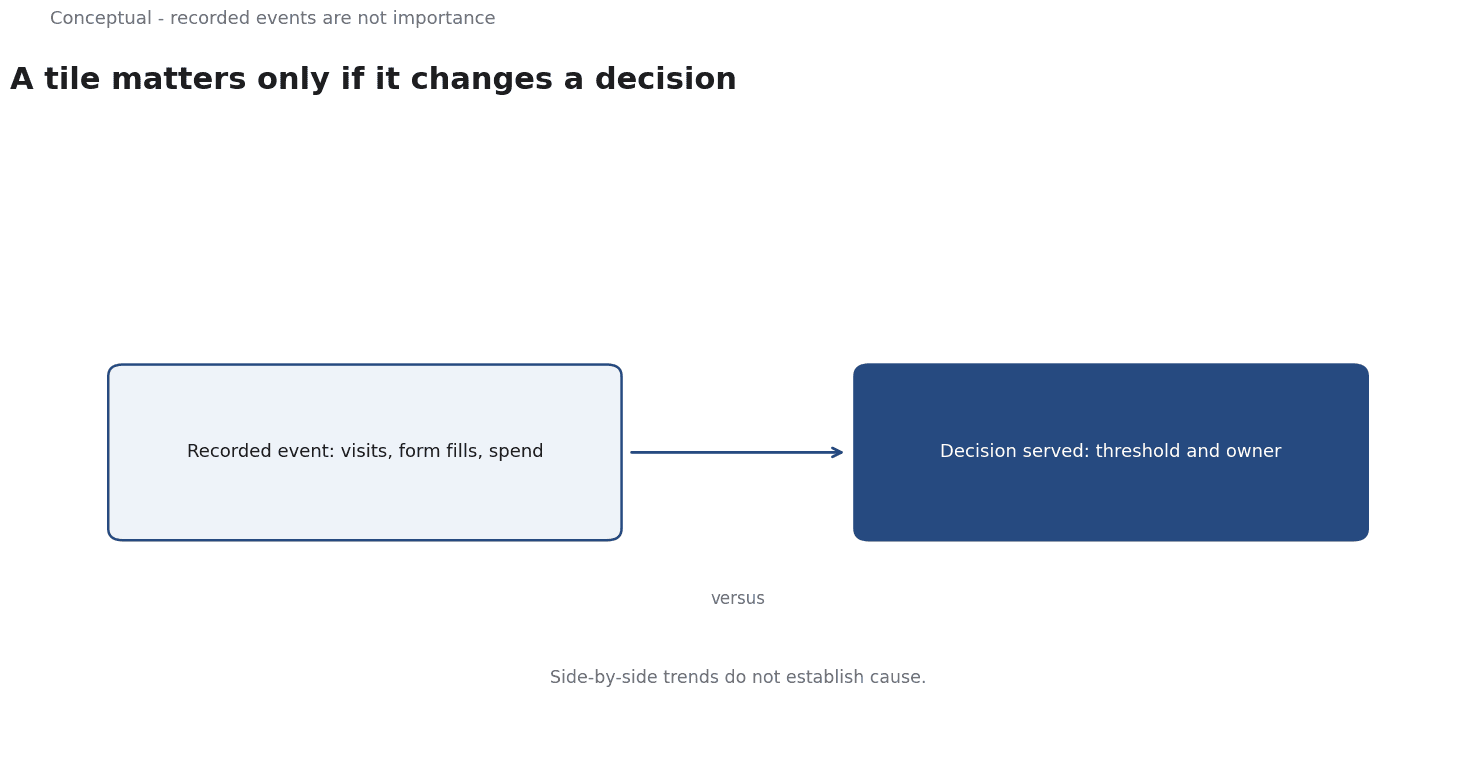
The practical consequence is that a dashboard shows what the instrumentation captures. If only clicks are tracked, the dashboard can report clicks but not why they happened or whether they led to revenue. Each metric is a reduction of raw events into a single number, and that reduction embeds definitions. What counts as a visit, what counts as a conversion, and what time window is used are all local choices. Two teams can show the same metric name while computing different things, because the definition lives in the tracking setup rather than in the label.
The sources describe analytics collection and decision processes; they do not say which metrics a particular team should display. Choosing metrics is therefore inferred, not source-reported. A useful discipline is to begin with the decision and ask which number would change it, instead of filling the screen with whatever data is available. This reverses the common order in which a team installs a tool, watches it populate, and only then asks what the numbers are for.
The consequence for practice is that a dashboard is most valuable when each tile is tied to a decision and a threshold.
Without that link, it becomes a reporting artifact that informs nobody. The same data can support different decisions, so the definition and the owner of each metric should be stated explicitly. A metric with no owner and no decision is a candidate for removal, because it consumes attention without improving a choice.
A worked example
The following is hypothetical and illustrative. A marketing lead reviews a dashboard that shows sessions, bounce rate, and form fills for a paid campaign. Three checks decide the review. First, does each metric connect to a decision the lead can make this week? Second, is the definition of a form fill explicit, including duplicates and test entries? Third, does the time window match the period over which the campaign could realistically change? The review finds that sessions and bounce rate are read but never acted on, while form fills drive a weekly budget call but include test submissions. The lead keeps form fills as the decision metric with a cleaned definition, moves the other two to context, and records the choice. The outcome is a metric decision, not a new tool. The numbers are hypothetical; the verification method is the contribution.
Evidence status
| Claim | Status | Source | Verified | Recheck when |
|---|---|---|---|---|
| Web analytics collects and reports site data | source-reported | Wikipedia, Web analytics | 2026-11-18 | Definition revised |
| Decision making uses information to choose among alternatives | source-reported | Wikipedia, Decision making | 2026-11-18 | Definition revised |
| Tie each dashboard metric to a decision and threshold | inferred | Derived from the sources | 2026-11-18 | Decision process changes |
The first two rows restate definitions found in the sources. The third row is a synthesis, since neither source prescribes dashboard design. Recheck the definitions if the source entries change, and recheck the inferred claim when the team's decision process or the set of available metrics changes.
What it cannot do
A dashboard cannot tell you what caused an outcome. It can show that a campaign and a rise in conversions occurred together, but the web analytics source describes collection and reporting, not causal inference. Establishing that one thing produced another requires a method the dashboard does not supply. A tile that labels two trends side by side invites a causal story that the data alone cannot support. Teams that read correlation from a dashboard as proof of effect will make budget decisions on a weak foundation.
The hidden cost is upkeep. Every metric needs its definition maintained, and definitions drift when tracking code changes or a platform alters how it counts an event. A dashboard can keep displaying a number that no longer means what it did, and nothing in the interface signals the change. The maintenance is invisible until someone questions the figure and discovers that the definition moved months earlier. This is why a dashboard can look stable while quietly becoming unreliable.
Adding tiles feels productive, but each new number competes for attention and encourages optimizing the metric rather than the goal it was meant to reflect. When a displayed number becomes a target, the behavior it measures can be gamed, and the dashboard will faithfully report the improved number while the underlying goal suffers. The sources do not address this risk, so it is an inference drawn from the gap between measuring and deciding.
There is a boundary around what a dashboard covers. It covers instrumented channels only. Offline effects, brand perception, and competitor actions sit outside it, as do conversations that never touch a tracked page. It also cannot replace judgment about which decision matters. The dashboard presents information; a person still decides which choice is worth making and what weight to give each number. Treating the dashboard as the decision maker mistakes the input for the choice.
Because both decisions and definitions change, a dashboard needs periodic review. Each metric should be checked against the decision it serves and retired if it no longer informs one. Definitions and recheck dates should be recorded next to the metric, and any threshold should be treated as a local choice rather than a documented fact. Without that record, a new team member cannot tell why a number is displayed.
The counterargument that more metrics are fair for exploration is incomplete when no tile is tied to a decision.
A decision test
- Name the decision the dashboard is meant to support.
- List the metrics currently displayed.
- For each, ask whether it would change that decision.
- Check that its definition is explicit and current.
- Remove tiles that inform no decision.
- Attach a threshold and an owner to the remaining metrics.
- Review on a schedule and record definitions with recheck dates.
A dashboard is a tool for narrowing attention, not for expanding it. The test ties each number to a choice and makes the definitions visible, so a reviewer can see what the metric means and when it should be questioned. For further reading, see Marketing Dashboards without the Hype.
References & Further Reading
- Wikipedia contributors, 2026. Web analytics - Wikipedia — Collection and interpretation of website behaviour data.
- Wikipedia contributors, 2026. Decision-making - Wikipedia — Overview of decision processes, trade-offs and the distinction between the decision and its outcome; secondary reference.