Why Some SaaS Businesses Have Better Economics Than Traditional Businesses
Recurring revenue and negative working capital look like free money. Read what SaaS economics really gain, what they hide, and how to compare the two.
Software businesses are routinely described as having better economics than almost any other kind of company, and the description is not wrong. But the reasons are usually given in a way that makes them sound free, and they are not free — they are a set of structural advantages that come with their own obligations.
Direct answer: SaaS economics are better because of three specific mechanisms: gross margins that improve with scale, revenue that is collected before it is delivered, and acquisition cost that falls as the product becomes self-serve. Each comes with a corresponding obligation — churn instead of one-off sales, deferred revenue instead of immediate revenue, and support and sales costs that shift rather than disappear.
A SaaS business is more capital-efficient than a services business at a given retention rate, and that condition is the whole argument.
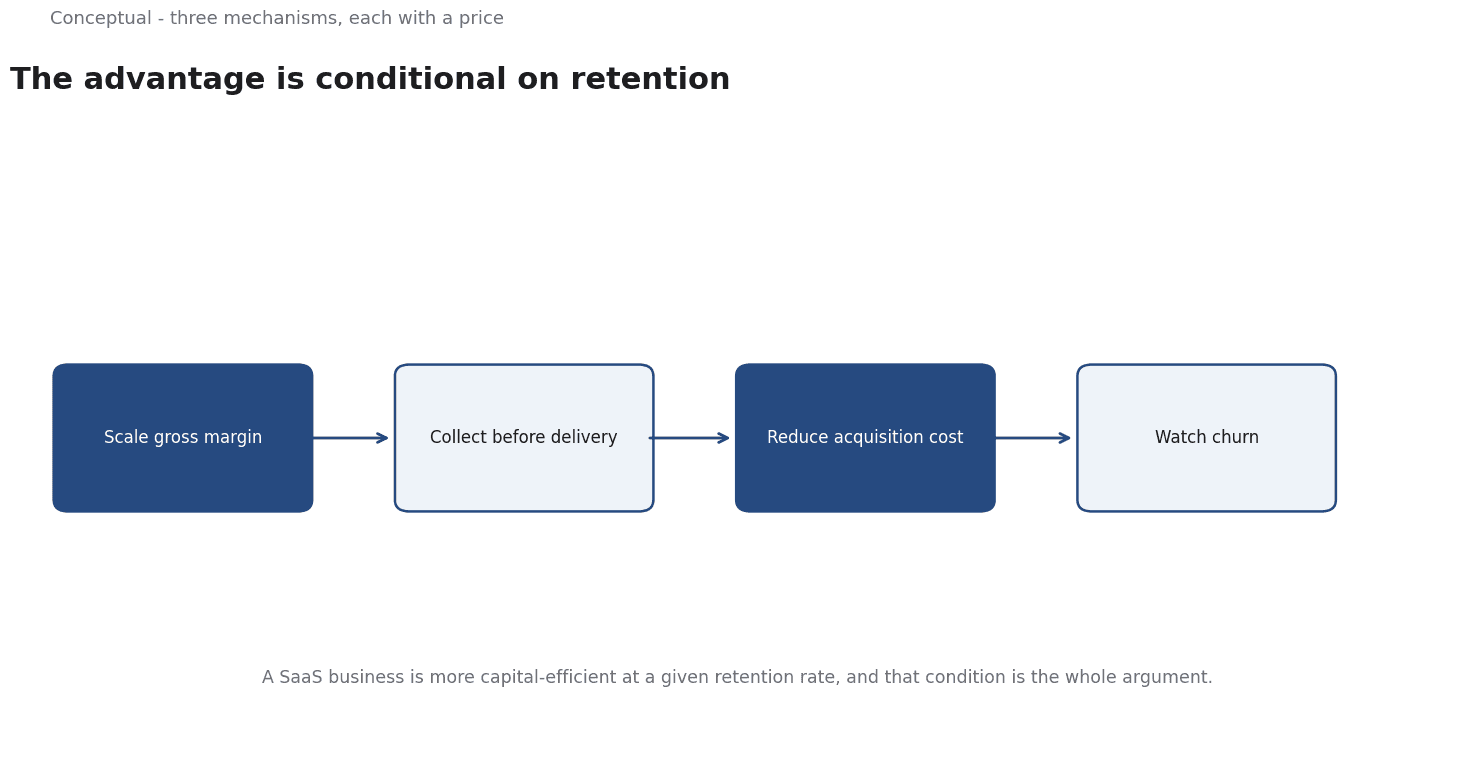
The three mechanisms, and their prices
Gross margin that improves. Software's marginal cost of serving one more customer is close to zero once the product exists, so gross margin rises with scale in a way that a physical-goods business never sees. The price is that this is a bet on the cost of serving a customer staying low, and the bet fails when support, hosting, or onboarding costs scale with the customer count.
Cash before revenue. Annual subscriptions paid in advance mean the business holds cash it has not yet earned the right to keep. That is a genuine working-capital advantage — the float is real money — and it is also a liability you will repay in service. Deferred revenue is not profit; it is a promise, and the renewal date is when the promise is tested.
Falling acquisition cost. Self-serve means a customer can start without a salesperson, which lowers the cost per acquisition and shortens the payback period. Product-led teams organise around this by building activation and engagement loops rather than campaigns. The price is that the cost has not disappeared — it has moved into the product, the onboarding flow, and the support capacity. A company can have a beautifully low self-serve CAC and a support cost that quietly consumes the difference, and the two numbers are rarely reported together.
Churn is the structural difference
The deepest difference between a SaaS company and a traditional one is not the margin. It is that the revenue recurs only if the customer stays, and the customer decides.
A business selling a one-off product gets a sale and then faces a replacement cycle that it does not control. A subscription business gets revenue that persists only through continued value delivery, and the customer's decision to leave is the dominant variable in the forecast.
This changes what a forecast is. A traditional business forecasts a pipeline of transactions; a SaaS business forecasts a transition matrix — how many customers at each tenure will renew, at what price, and with what expansion. The mathematically meaningful measure is a cohort retention curve, and the number that matters commercially is the payback period, because churn that exceeds what acquisition economics can absorb compounds.
It also changes the failure mode. A SaaS company that grows bookings while retention decays is not growing; it is running a treadmill where each cohort's renewal losses are covered by the next cohort's acquisition. This is invisible in a revenue chart, which is why the cohort curve is the report that matters.
The measurement has to come from events
None of this can be computed without knowing what the behaviour actually is, and the event model determines what is knowable.
Google Analytics describes the unit of measurement directly: "An event allows you to measure a specific interaction or occurrence on your website or app" — a page load, a link click, a purchase, an app crash, an impression served. For a product-led business this is not bookkeeping; it is the definition of the loop. If activation is "invited a colleague" and the event that is actually recorded is "created a workspace", the metric is a proxy for the loop, and it will drift as the product changes without anyone noticing.
The same discipline applies to the financial side of the comparison. The retail and subscription data published by bodies such as the National Retail Federation give the alternative business model a benchmark, which matters when someone claims the software economics are structurally superior — the claim should be measured against comparable businesses in the same end market, not against a vague memory of what a distributor's margin looks like.
A comparison that does not flatter either side
The honest comparison runs on four lines, and it is easier to do than it is usually attempted.
Gross margin after the costs that scale. Include support, onboarding, hosting, and any per-customer implementation labour. This is the number that tells you whether you have software economics.
Cash conversion. A subscription business collects in advance; a services business collects on delivery. Compare the cash the two models actually hold, and check whether the deferred revenue is being treated as profit.
Payback period on acquisition cost. Both models can be measured the same way, and the comparison is meaningful only if acquisition cost is fully loaded in both.
Revenue durability. A one-off sale is durable in the sense that it is already earned; a subscription is not. Discount the recurring revenue, or compare it against the pipeline a traditional business would need to sustain the same run rate.
The outcome is not that SaaS is better. It is that SaaS is better when the retention holds, and the retention is the thing to watch. Which also explains the pattern seen across the market: the SaaS companies with the strongest economics are not the ones with the lowest churn by a small margin; they are the ones whose product makes leaving feel like a loss, and that is a product property before it is a financial one.
For the metric that connects retention to acquisition spending, see Customer Lifetime Value; for the loop mechanics, see Product-Led Growth.
A worked example
The following is hypothetical and illustrative. A hypothetical team sells a project tool on an annual subscription paid upfront and wants to claim better economics than a comparable services firm in the same end market. First, compute gross margin after the costs that scale: take the subscription price, then subtract support, onboarding, hosting, and any per-customer implementation labour; suppose the remainder is thinner than the headline margin suggests because implementation staff grow with each account. Second, test cash conversion and payback: the advance payment creates deferred revenue that is a promise, not profit, so compare the cash actually held against fully loaded acquisition cost and check the payback period rather than the booking. Third, judge revenue durability with a cohort retention curve and the activation and engagement loop behind it; using Google Analytics events, confirm that the loop's event is recorded rather than a proxy such as a workspace creation. The bounded outcome is a like-for-like comparison on these three lines against NRF-benchmarked peers; if retention holds and scaled costs stay low, the software model wins on capital efficiency, and if not, the advantage was never there.
A counterargument
A critic could argue the better-economics claim is hedged into a near-tautology: SaaS wins when retention holds and does not when it fails, making the comparison depend on a variable the piece calls a product property rather than a financial one. Its cited sources explain how to observe the loop, not why the model is structurally superior. Google Analytics defines an event as a measurable interaction, which says what can be tracked, not whether low marginal cost endures; Wes Bush's activation and engagement loop describes product-led practice rather than a margin advantage; NRF data benchmarks a different end market, and the article never completes the comparison it says is right.
Each of the three mechanisms is shown to carry an offsetting cost, so no net advantage over a well-run traditional business is actually demonstrated.
References & Further Reading
- Wes Bush, 2026. Product-Led Growth — The activation and engagement loop definition that PLG teams actually use.
- Google Analytics Help, 2026. About events (Google Analytics 4) — How an event is defined as a measurable interaction or occurrence, and why the event model determines what can be reported at all.
- National Retail Federation, 2026. NRF Press Releases | Latest Statements & Announcements | NRF — Primary retail-sales and channel data for sell-in versus sell-out definitions.