Correlation Analysis Costs Explained
Correlation is cheap to compute and expensive to act on wrongly. Read where the cost appears, a worked example, and why it does not establish cause.
A correlation coefficient is easy to produce, which is why it appears in dashboards and reports without much scrutiny. The cost is not the computation but what follows from acting on it: a team that treats a correlation as a cause can spend money on an intervention that changes nothing, as the correlation-versus-causation article warns about the most common mistake in data analysis.
Direct answer: Correlation measures co-movement, not cause, and its cost appears in wrong interventions, missed alternatives, and poor forecasts. Wikipedia's correlation entry defines the measure, and AAPOR's standards apply to the survey data that often supplies the variables. The boundary: a high correlation is not evidence of a mechanism, which the causal-inference article treats as a separate question requiring a different design.
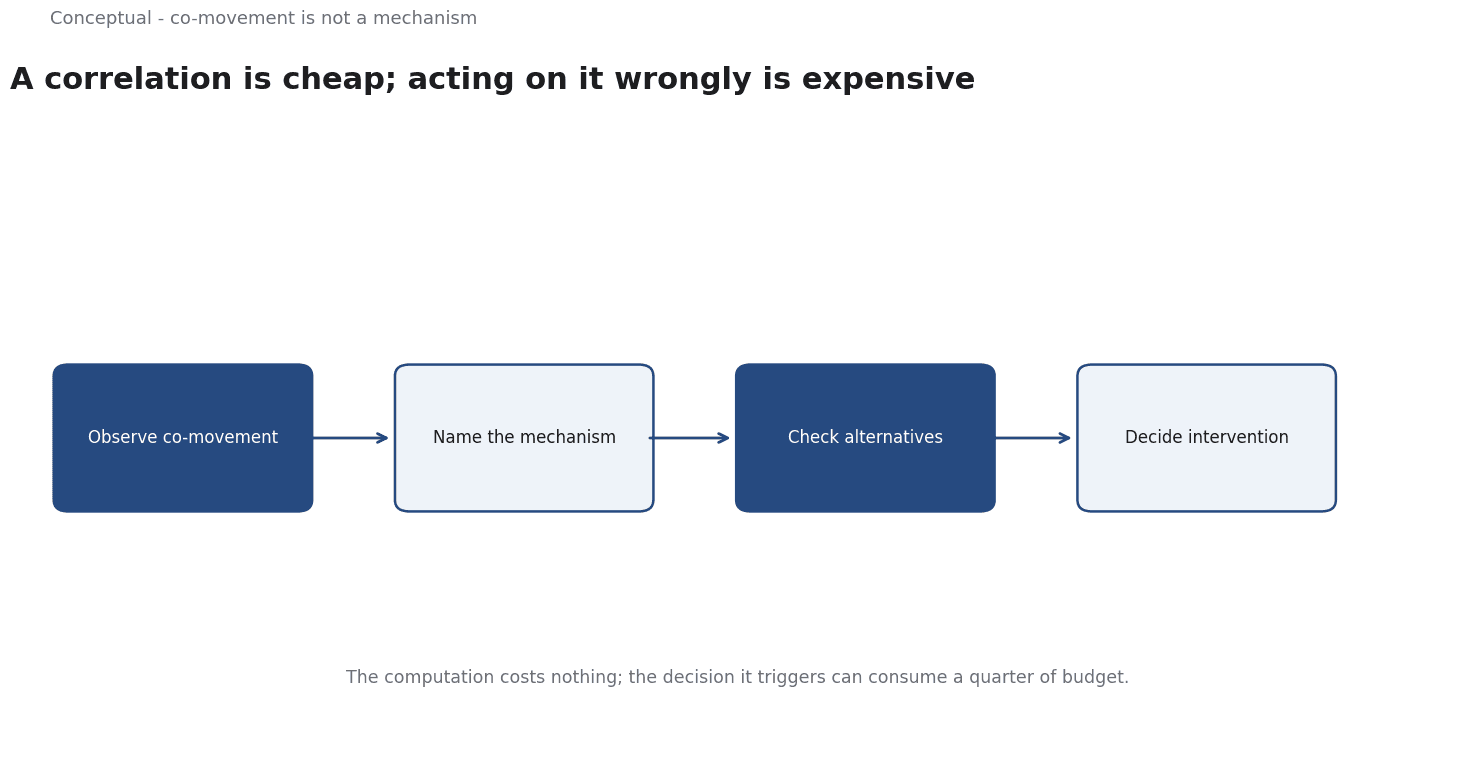
Where the cost appears
Wrong interventions. If two metrics move together because a third factor drives both, acting on one will not change the other, which the correlation-versus-causation article explains for confounding. The spend is the cost, as the marketing-budget article treats allocation decisions.
Missed alternatives. A focus on the correlated variable can hide the real driver, which the feature-engineering article treats as a question of context, as the data-quality article warns about what a proxy leaves out.
Fragile forecasts. A relationship observed in one period may not hold in another, which the time-series article treats as non-stationarity, as the monitoring article advises for any pattern tied to a changing system.
Three consequences follow. The analysis should state the question and the population, which AAPOR's standards require for survey-derived data, as the data-governance article requires provenance. It should separate description from causal claims, as Causal Inference: Counterfactuals, DAGs, and Do-Calculus advises. And it should be labelled with its limitations, which the publication standard requires for all material claims.
A worked example
The following is hypothetical and illustrative. A retailer observes a strong correlation between email open rates and in-store purchases, and proposes to spend more on email to lift purchases.
Three checks decide whether the correlation justifies the spend. First, is there a common cause, such as a promotion that drives both opens and purchases, which the correlation-versus-causation article asks for? Second, did purchases change when opens changed independently, which the geo-experiment guidance tests with a comparison? Third, is the relationship stable across seasons, which the time-series article treats as non-stationarity?
Three conclusions follow.
The correlation is a signal, not a plan, which the causal-inference article argues.
A controlled test is cheaper than a broad campaign based on an assumption, as the budget article advises for allocation. And the result should be recorded with the limitation, as the decision-memo article requires.
The cost of a cheap coefficient
The reason correlations are expensive to act on is that they arrive early in an analysis, before the harder questions have been asked.
The computation itself costs nothing; the decision it triggers can consume a quarter of budget, as the marketing-budget article frames allocation.
This is why the discipline is to write down the alternative explanations before the coefficient is used, as the risk-assessment article recommends for known failure modes. A common cause, a selection effect, and a reverse direction are the three candidates that should be named explicitly, which the correlation-versus-causation article treats as the standard checks, as Causal Inference: Counterfactuals, DAGs, and Do-Calculus requires a different design to distinguish them.
Finally, the cost is often delayed. A decision based on a fragile correlation can look successful for a period, then fail when the underlying relationship shifts or a competitor changes the system, as the time-series article warns about non-stationarity, as the monitoring article advises for re-checking any pattern tied to a changing environment. The original analysis was not wrong; it was applied beyond the conditions it described, which the publication standard requires articles to state honestly.
What correlation analysis cannot do
It cannot establish direction, which the correlation definition makes clear, as Causal Inference: Counterfactuals, DAGs, and Do-Calculus treats direction as a design question. It cannot replace a mechanism, which the feature-engineering article argues for context over statistical appeal. And it does not guarantee a forecast, which the time-series article treats as conditional, as the valuation article advises for any projection.
The counterargument that correlation is still useful for prediction is fair, which the predictive-analytics article treats as a distinct goal, provided the label is honest, as the publication standard requires.
A decision test
- State the question and the population, as AAPOR's standards require.
- Check for a common cause before acting, as the correlation-versus-causation article advises.
- Test the intervention with a comparison, as the geo-experiment guidance recommends.
- Check stability across periods, as the time-series article advises.
- Label the finding as association, as the correlation entry requires.
- Record the decision and the limitation, as the decision-memo article requires.
- Re-check when the system changes, as the monitoring article advises.
For the distinction, see Correlation vs Causation; for the method, see Causal Inference.
References & Further Reading
- Wikipedia contributors, 2026. Correlation - Wikipedia — The definition of correlation and the distinction from causation.
- American Association for Public Opinion Research, 2026. AAPOR — The professional association for public opinion and survey research; its standards and resources underpin the survey-design discussion.